Summary
Updated 11 November 2026. The figures now run to 9 November 2026. They come from the backtest results, which re-run every setup in this report after each trading day, so they differ a little from the 7 November edition: one more trading day, and costs charged on every order at its fill price (profit after costs up to about 0.3% lower). The two overview charts keep the 7 November edition’s figures (data to 6 November 2026).
Management, not entries, separates good and great option selling results. Holding the same Arko’s Strategy signal trades and changing only the strike and the exit rule, the study evaluated 43 strike and exit combinations on five years of one minute option prices with full statutory costs.
- Every strike made money; depth sets the risk. Selling ATM+2 through ITM2 on identical signals was profitable in all six calendar years, from Rs 3,79,955 to Rs 7,30,651 per lot after costs. Profit and drawdown scale together up to ITM1.
- A lock with reentry lifts accuracy above 50%. Locking 60% of peak profit after 20 points and selling again after a 15 minute cool off raised ITM1 accuracy from 42.7% to 53.2% and profit to Rs 7,09,243 (+28,050 vs plain), while the worst month improved from Rs −16,701 to Rs −9,162. Maximum drawdown was Rs −28,804.
- It transfers to the strikes retail sellers use. ATM reached 51.6% accuracy (Rs 6,02,460); ATM+1 51.0% (Rs 5,09,045); ATM+2 51.1%.
- Simple trails help at the margin. On ITM1 the 30% / 100 point / 50% trail beat plain holding in all six years (Rs 7,04,372). The wide 15% / 100 point / 100% trail helped every strike.
- Booking profit early is costly. Profit targets, tight stops, daily limits and locks without reentry cut five year profit by Rs 0.1 to 2.6 lakh per lot.
Configurations by trader profile
1 lot, five years, before and after costs.
| Profile | Configuration | Trades | Accuracy | Before costs | After costs | Max drawdown | Worst month |
|---|---|---|---|---|---|---|---|
| Balanced | ITM1, lock 20 / keep 60% / 15 minute cool off | 3,730 | 53.2% | 7,58,185 | 7,09,243 | −28,804 | −9,162 |
| Maximum profit | ITM2, lock 30 / keep 60% / 15 minute cool off | 3,437 | 47.8% | 8,20,112 | 7,63,629 | −36,809 | −19,375 |
| Simplest rule | ITM1, trail 30 / 100 / stop 50% | 2,876 | 42.6% | 7,43,090 | 7,04,372 | −33,142 | −15,024 |
| Retail ATM | ATM, lock 20 / keep 60% / 15 minute cool off | 3,442 | 51.6% | 6,39,103 | 6,02,460 | −25,762 | −9,195 |
| Low risk | ATM+1 (OTM1), lock 20 / keep 60% / 15 minute cool off | 3,227 | 51.0% | 5,36,704 | 5,09,045 | −23,967 | −8,538 |
| Lowest risk | ATM+2 (OTM2), wide trail 15 / 100 / stop 100% | 2,879 | 48.5% | 4,08,664 | 3,89,712 | −18,547 | −7,440 |
Source: Arko's Strategy Research. Hypothetical backtest, weekly Nifty options, 11 Oct 2021 to 9 Nov 2026, 1 lot, statutory costs, zero brokerage. All amounts in Rs. Accuracy = trades profitable before costs.
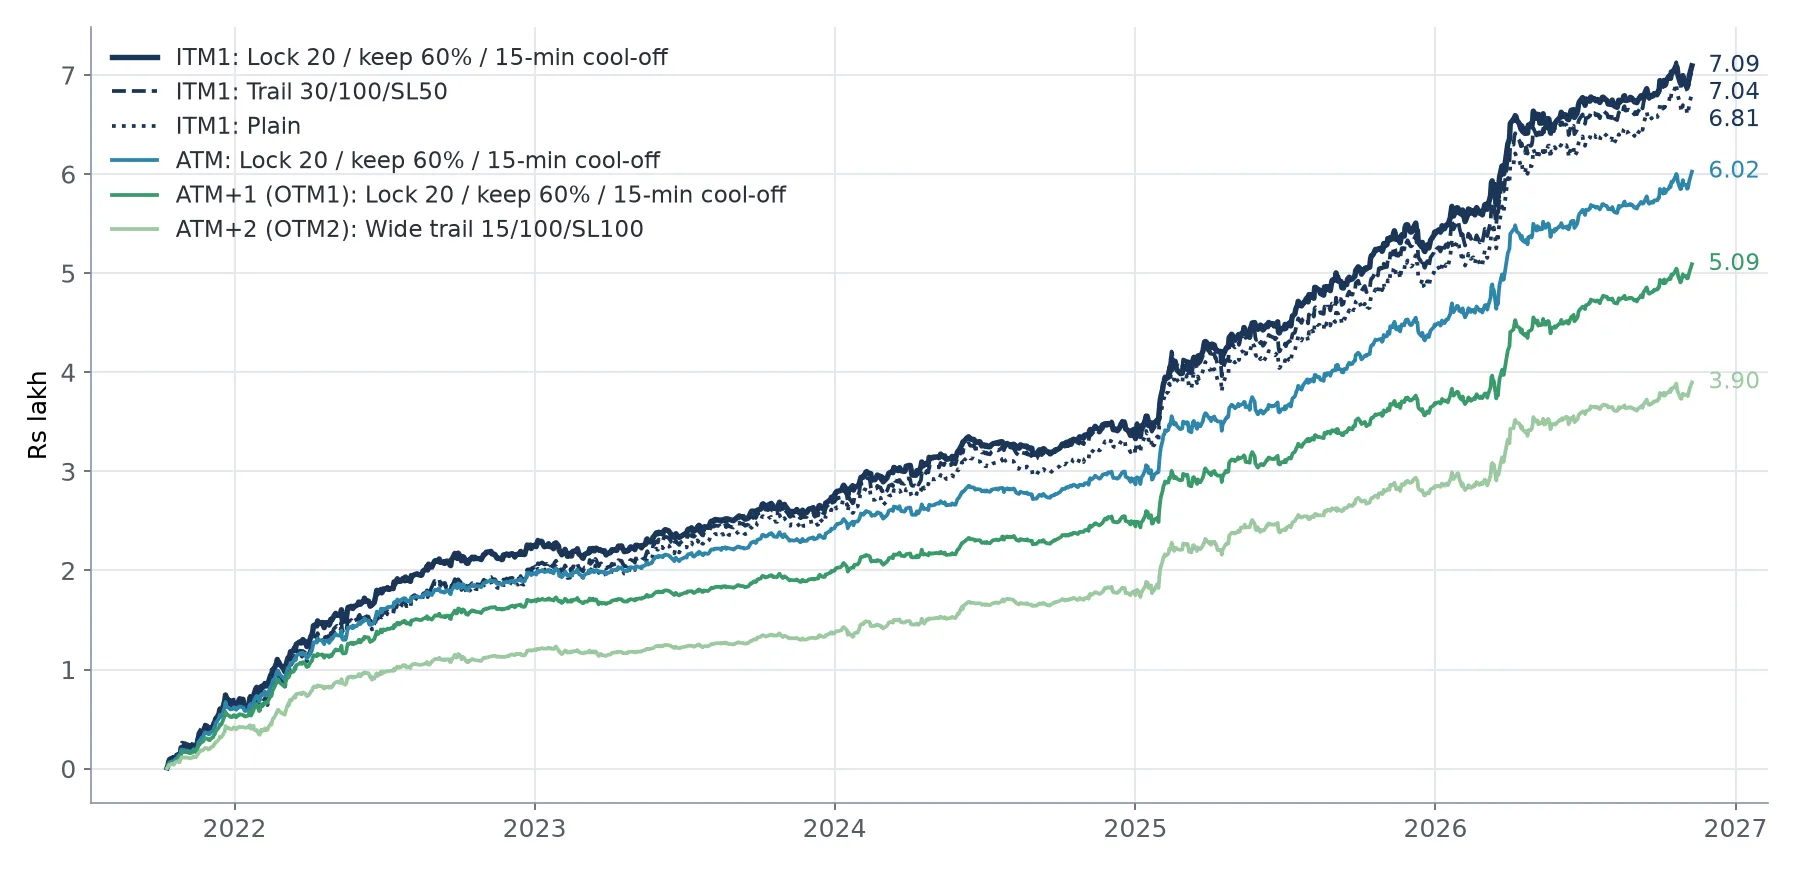
Cumulative profit after costs, selected configurations (Rs lakh, 1 lot). Hypothetical backtest; past performance does not guarantee future results.
Introduction
Retail option sellers spend most of their effort on entry timing, yet a large part of the outcome is decided after entry: which strike is sold, when profit is protected, and whether a position that has been closed should be opened again. This report isolates those decisions. The entry and exit signals are held fixed throughout; every configuration trades exactly the same signal events, and only the option contract and the rule that manages the trade change.
Arko’s Strategy is a proprietary signal model on the Nifty 50 index chart. It produces a Buy signal (bullish), a Sell signal (bearish) and a close signal. The signal logic is not published; this report covers how to trade the signals with options.
The study addresses four questions:
- How do profit, accuracy and risk change across the strikes commonly sold, from two strikes out of the money to two strikes in the money?
- Do trailing stops on the sold option improve results, and which settings are stable rather than lucky?
- Can a profit lock combined with a reentry rule raise accuracy without cutting the long winning trades?
- Which configuration suits which kind of trader?
Data and method
Data
The sample covers 11 October 2021 to 9 November 2026. Option prices are one minute closing prices for every weekly Nifty 50 index option contract, including the monthly contract in the weeks it serves as the weekly expiry. Lot sizes follow the exchange schedule in force on each expiry (50, then 25, 75 and 65 units). Each configuration produces about 2,880 signal trades.
Trade construction
- A Buy signal sells a weekly put; a Sell signal sells a weekly call. A seller profits when the premium falls.
- A close signal buys the option back. Only one position is open at a time; an opposite signal closes the existing position and opens a new one on the same candle.
- Every trade uses the nearest Nifty expiry. In the week when the monthly contract is the nearest expiry, it is treated as that week’s weekly expiry.
- Positions are carried overnight until the strategy closes them. A position still open on expiry day is closed and opened again in the following week’s contract. Entries on expiry day are permitted.
- Chart settings: 5 minute Nifty chart, Shorter Closing mode, Strength 5. Strikes are picked relative to the at the money (ATM) strike at entry, 50 points apart. ATM+1 and ATM+2 are one and two strikes out of the money; ITM1 and ITM2 are one and two strikes in the money.
- The hedged spread sells ITM2 and buys the same option type 12 strikes further out of the money; both legs are closed together.
Execution and costs
- Signal trades fill at the close of the signal candle; exit rule trades fill at the close of the minute that triggers them. Every order pays 1 tick (Rs 0.05) of slippage.
- Statutory charges are applied at the rates in force on each trade date: securities transaction tax on sell premium (0.0625%, 0.10% from October 2024, 0.15% from April 2026), exchange transaction charges, SEBI fees, stamp duty and GST. Brokerage is set to zero, as offered by several discount brokers.
- Results are reported both before costs (with slippage) and after costs.
Exit rules tested
Eight position management rules were applied to each naked strike, and three to the hedged spread. Trailing stops close a position and do not reenter. Profit locks may sell the same strike again while the strategy position remains open, after which the lock restarts on the new trade.
| Rule | Definition |
|---|---|
| Plain | Hold until the strategy’s close signal or weekly expiry; no additional rule. |
| Wide trail 15 / 100 / stop 100% | Arms once the premium is 15% below the sale price; buys back on a 100 point rebound from the lowest premium since entry. Independent stop: buy back if the premium doubles. |
| Trail 30 / 100 / stop 50% | Arms after a 30% fall; buys back on a 100 point rebound from the low; independent stop at 150% of the sale price. |
| Lock 20 / keep 60% / 15 minute cool off | Arms once open profit reaches 20 points; the stop then trails so that at least 60% of the peak open profit is kept. After a lock exit, if the premium is still below the buyback price 15 minutes later, the same strike is sold again. |
| Lock 30 / keep 60% / 15 minute cool off | As above, arming at 30 points of profit. |
| Lock 30 / keep 60% / sell again 10 lower | Lock as above; sell again when the premium falls 10 points below the lock exit price. |
| Lock 30 / keep 60% / Nifty +20 | Lock as above; sell again when Nifty moves 20 points beyond its level at the lock exit, in the trade’s favour. |
| Lock 20 / keep 50% / Nifty +20 | Arms at 20 points, keeps 50% of peak profit; reentry as above. |
Evaluation metrics
- Profit after costs over the full sample, per lot.
- Accuracy: the share of trades profitable before costs; every reentry counts as a separate trade. With zero brokerage, the share after costs is only 0.0 to 0.3 percentage points lower.
- Maximum drawdown of the closed trade equity curve, worst calendar month, number of losing months and the longest run of losing trades.
- Stability: the number of calendar years in which a configuration beat the same strike held plain, and profitability in each calendar year.
Scale of testing
The configurations reported here were selected from more than 30,000 backtest variants run across the wider research programme, covering signal timeframes, closing modes and strengths, fifteen strike selection rules, hedged spreads, over 10,000 trailing stop parameter sets, about 1,900 profit lock and reentry parameter sets, entry filters, and slippage stress tests from 1 to 5 ticks.
Results
Overview of all combinations
The chart below places all 43 combinations by accuracy and profit. Strike choice moves results mainly up and down; profit locks move them to the right by raising accuracy; trailing stops move them up slightly.
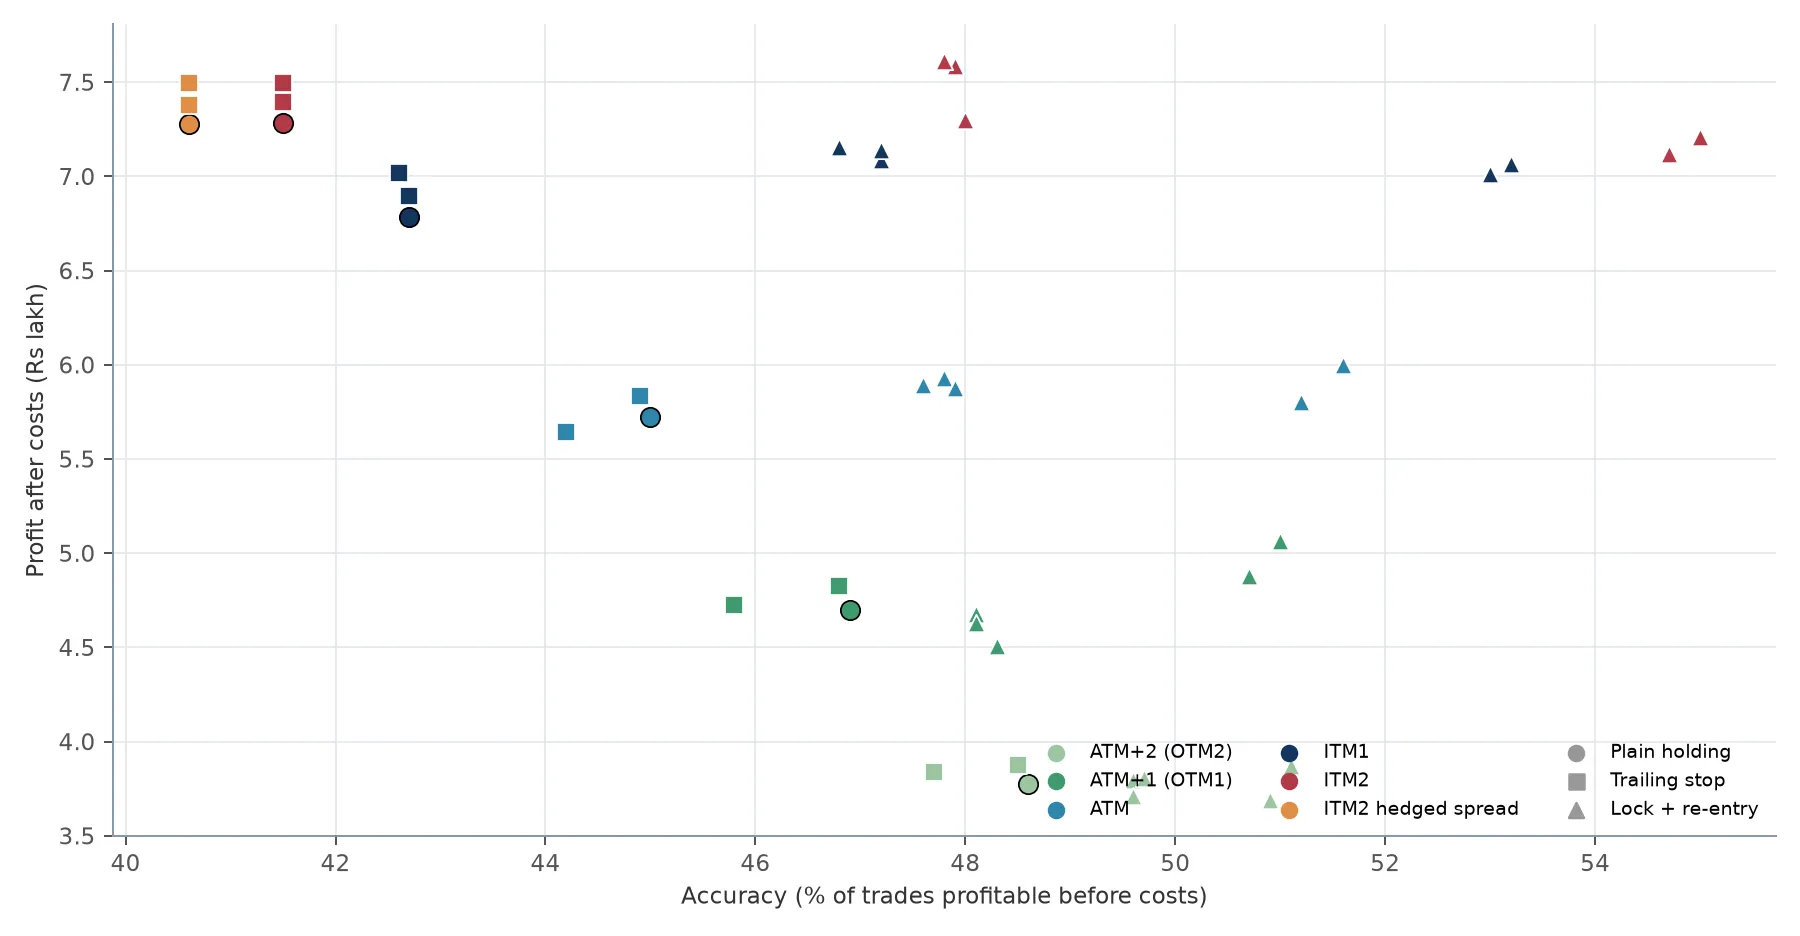
Accuracy against profit after costs, all 43 strike and management combinations. 7 November edition, data to 6 November 2026. Hypothetical backtest, 1 lot.
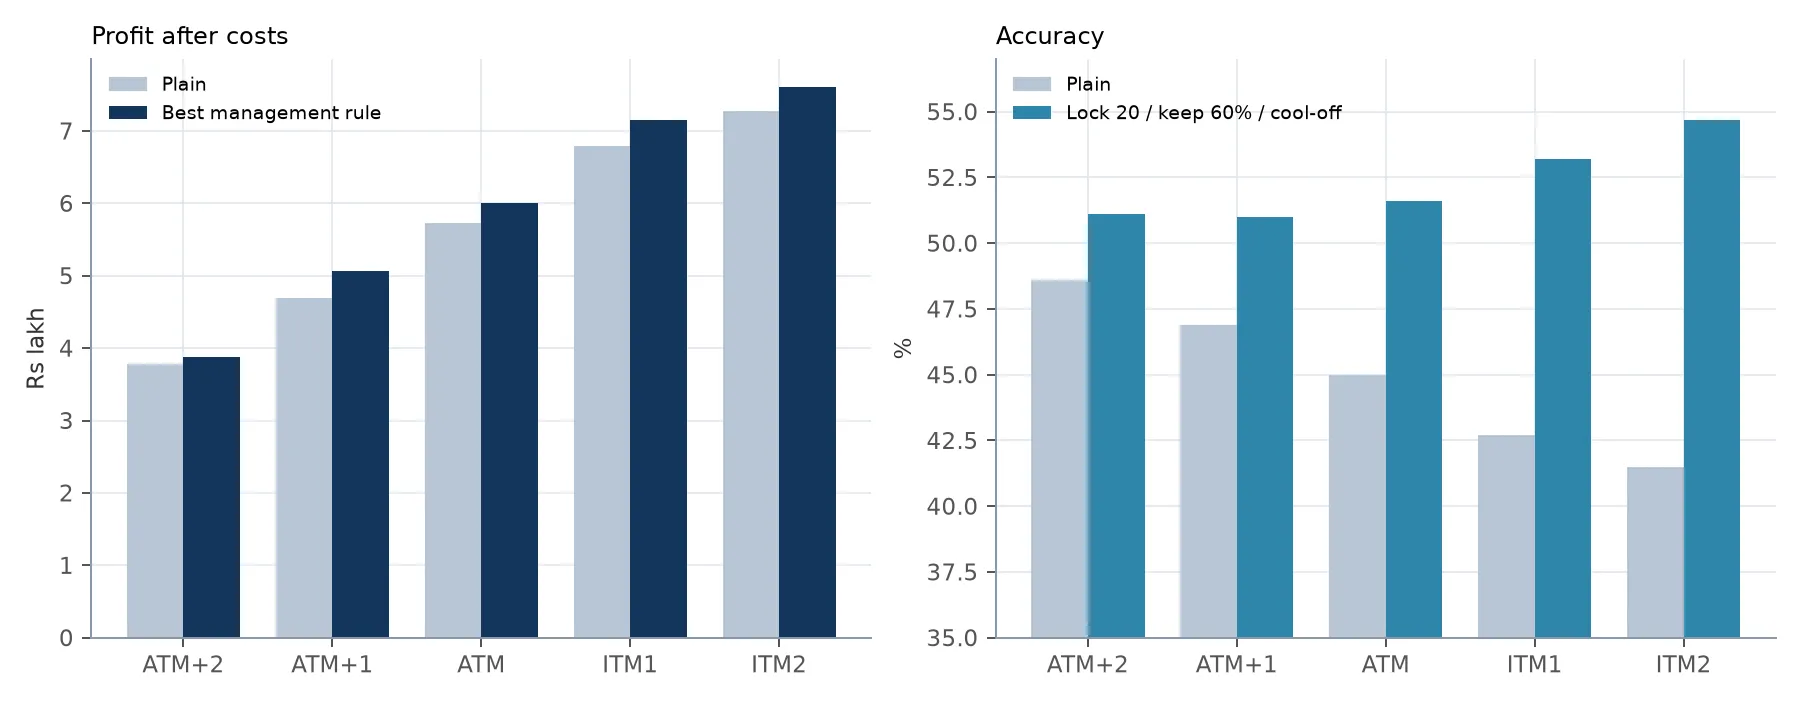
By strike: plain against the best management rule (profit), and plain against lock 20 / keep 60% / cool off (accuracy). 7 November edition, data to 6 November 2026. Hypothetical backtest, 1 lot.
Combinations that beat plain holding
Every combination that beat the same strike held plain, ranked by profit after costs. Each of these was profitable in all six calendar years.
| # | Strike | Exit rule | Note | Trades | Accuracy | Before costs | After costs | vs plain | Max drawdown | Worst month | Years above plain |
|---|---|---|---|---|---|---|---|---|---|---|---|
| 1 | ITM2 | Lock 30 / keep 60% / 15 minute cool off | Highest profit overall | 3,437 | 47.8% | 8,20,112 | 7,63,629 | +32,978 | −36,809 | −19,375 | 3/6 |
| 2 | ITM2 | Trail 30 / 100 / stop 50% | 2,879 | 41.5% | 8,00,614 | 7,51,964 | +21,313 | −40,081 | −20,502 | 4/6 | |
| 3 | ITM2 hedged spread | Trail 30 / 100 / stop 50% | High profit, defined risk | 2,878 | 40.6% | 8,03,447 | 7,51,132 | +21,557 | −38,169 | −19,055 | 5/6 |
| 4 | ITM1 | Lock 30 / keep 60% / 15 minute cool off | Highest ITM1 profit | 3,242 | 46.8% | 7,61,741 | 7,18,389 | +37,196 | −34,299 | −15,250 | 3/6 |
| 5 | ITM1 | Lock 30 / keep 60% / sell again 10 lower | High profit, lower drawdown | 3,254 | 47.2% | 7,60,304 | 7,16,703 | +35,510 | −31,621 | −17,556 | 3/6 |
| 6 | ITM1 | Lock 30 / keep 60% / Nifty +20 | 3,227 | 47.2% | 7,54,822 | 7,11,579 | +30,386 | −34,969 | −14,378 | 4/6 | |
| 7 | ITM1 | Lock 20 / keep 60% / 15 minute cool off | Best all rounder | 3,730 | 53.2% | 7,58,185 | 7,09,243 | +28,050 | −28,804 | −9,162 | 3/6 |
| 8 | ITM1 | Trail 30 / 100 / stop 50% | Simplest add on, beats plain every year | 2,876 | 42.6% | 7,43,090 | 7,04,372 | +23,179 | −33,142 | −15,024 | 6/6 |
| 9 | ITM1 | Lock 20 / keep 50% / Nifty +20 | High accuracy | 3,416 | 53.0% | 7,49,487 | 7,03,910 | +22,717 | −30,776 | −13,269 | 4/6 |
| 10 | ITM1 | Wide trail 15 / 100 / stop 100% | Simplest, gentlest | 2,879 | 42.7% | 7,31,292 | 6,92,494 | +11,301 | −33,108 | −17,173 | 4/6 |
| 11 | ATM | Lock 20 / keep 60% / 15 minute cool off | Best retail pick | 3,442 | 51.6% | 6,39,103 | 6,02,460 | +27,515 | −25,762 | −9,195 | 5/6 |
| 12 | ATM | Lock 30 / keep 60% / Nifty +20 | 3,107 | 47.8% | 6,28,759 | 5,95,575 | +20,630 | −32,158 | −11,896 | 4/6 | |
| 13 | ATM | Lock 30 / keep 60% / 15 minute cool off | 3,105 | 47.6% | 6,25,004 | 5,91,876 | +16,931 | −32,058 | −12,166 | 5/6 | |
| 14 | ATM | Wide trail 15 / 100 / stop 100% | Retail, simplest | 2,878 | 44.9% | 6,16,456 | 5,86,047 | +11,102 | −26,513 | −12,445 | 4/6 |
| 15 | ATM+1 (OTM1) | Lock 20 / keep 60% / 15 minute cool off | Best low risk pick | 3,227 | 51.0% | 5,36,704 | 5,09,045 | +36,569 | −23,967 | −8,538 | 5/6 |
| 16 | ATM+1 (OTM1) | Lock 20 / keep 50% / Nifty +20 | 3,116 | 50.7% | 5,17,101 | 4,90,484 | +18,008 | −23,092 | −10,241 | 3/6 | |
| 17 | ATM+1 (OTM1) | Wide trail 15 / 100 / stop 100% | Low risk, simplest | 2,876 | 46.8% | 5,09,282 | 4,85,392 | +12,916 | −22,325 | −8,680 | 5/6 |
| 18 | ATM+2 (OTM2) | Wide trail 15 / 100 / stop 100% | Lowest risk, simplest | 2,879 | 48.5% | 4,08,664 | 3,89,712 | +9,757 | −18,547 | −7,440 | 5/6 |
| 19 | ATM+2 (OTM2) | Lock 20 / keep 60% / 15 minute cool off | Lowest risk | 3,124 | 51.1% | 4,11,099 | 3,89,667 | +9,712 | −20,442 | −6,538 | 3/6 |
Source: Arko's Strategy Research. Hypothetical backtest, weekly Nifty options, 11 Oct 2021 to 9 Nov 2026, 1 lot, statutory costs, zero brokerage. All amounts in Rs. Accuracy = trades profitable before costs. Plain reference (after costs / accuracy / max drawdown): ATM+2 (OTM2) 3,79,955 / 48.6% / −18,547; ATM+1 (OTM1) 4,72,476 / 46.9% / −22,325; ATM 5,74,945 / 45.0% / −26,795; ITM1 6,81,193 / 42.7% / −33,108; ITM2 7,30,651 / 41.5% / −40,741.
Results by strike
All tables: 1 lot, Rs, full sample. Losing months are out of 62.
ATM+2 (OTM2)
Lowest premium (about Rs 63) and the smallest losses. The 20 point lock and the wide trail both add about Rs 10,000; the lock lifts accuracy above 50%.
| Exit rule | Trades | Accuracy | Before costs | After costs | vs plain | Max drawdown | Worst month | Losing months |
|---|---|---|---|---|---|---|---|---|
| Wide trail 15 / 100 / stop 100% | 2,879 | 48.5% | 4,08,664 | 3,89,712 | +9,757 | −18,547 | −7,440 | 14/62 |
| Lock 20 / keep 60% / 15 minute cool off | 3,124 | 51.1% | 4,11,099 | 3,89,667 | +9,712 | −20,442 | −6,538 | 14/62 |
| Trail 30 / 100 / stop 50% | 2,868 | 47.7% | 4,04,908 | 3,86,078 | +6,123 | −18,418 | −9,026 | 13/62 |
| Lock 30 / keep 60% / sell again 10 lower | 2,961 | 49.7% | 4,03,020 | 3,83,112 | +3,157 | −19,401 | −7,012 | 16/62 |
| Lock 30 / keep 60% / Nifty +20 | 2,967 | 49.6% | 4,01,841 | 3,81,839 | +1,884 | −19,167 | −7,161 | 15/62 |
| Plain | 2,879 | 48.6% | 3,98,912 | 3,79,955 | 0 | −18,547 | −9,814 | 14/62 |
| Lock 30 / keep 60% / 15 minute cool off | 2,966 | 49.6% | 3,93,742 | 3,73,772 | −6,183 | −20,090 | −7,731 | 16/62 |
| Lock 20 / keep 50% / Nifty +20 | 3,051 | 50.9% | 3,92,510 | 3,71,620 | −8,335 | −20,656 | −10,041 | 14/62 |
ATM+1 (OTM1)
Premium about Rs 80. The 20 point lock with cool off adds about 8% to profit, lifts accuracy above 50% and keeps the worst month under Rs 9,000.
| Exit rule | Trades | Accuracy | Before costs | After costs | vs plain | Max drawdown | Worst month | Losing months |
|---|---|---|---|---|---|---|---|---|
| Lock 20 / keep 60% / 15 minute cool off | 3,227 | 51.0% | 5,36,704 | 5,09,045 | +36,569 | −23,967 | −8,538 | 13/62 |
| Lock 20 / keep 50% / Nifty +20 | 3,116 | 50.7% | 5,17,101 | 4,90,484 | +18,008 | −23,092 | −10,241 | 13/62 |
| Wide trail 15 / 100 / stop 100% | 2,876 | 46.8% | 5,09,282 | 4,85,392 | +12,916 | −22,325 | −8,680 | 15/62 |
| Trail 30 / 100 / stop 50% | 2,863 | 45.8% | 4,98,943 | 4,75,224 | +2,748 | −21,281 | −9,224 | 13/62 |
| Plain | 2,879 | 46.9% | 4,96,416 | 4,72,476 | 0 | −22,325 | −9,759 | 15/62 |
| Lock 30 / keep 60% / Nifty +20 | 3,022 | 48.1% | 4,96,036 | 4,70,366 | −2,110 | −23,934 | −8,626 | 15/62 |
| Lock 30 / keep 60% / 15 minute cool off | 3,016 | 48.1% | 4,91,312 | 4,65,762 | −6,714 | −24,862 | −8,849 | 15/62 |
| Lock 30 / keep 60% / sell again 10 lower | 3,025 | 48.3% | 4,79,290 | 4,53,654 | −18,822 | −25,910 | −10,759 | 15/62 |
ATM
Premium about Rs 102. The 20 point lock with cool off gives the highest profit and accuracy and the smallest worst month for this strike.
| Exit rule | Trades | Accuracy | Before costs | After costs | vs plain | Max drawdown | Worst month | Losing months |
|---|---|---|---|---|---|---|---|---|
| Lock 20 / keep 60% / 15 minute cool off | 3,442 | 51.6% | 6,39,103 | 6,02,460 | +27,515 | −25,762 | −9,195 | 10/62 |
| Lock 30 / keep 60% / Nifty +20 | 3,107 | 47.8% | 6,28,759 | 5,95,575 | +20,630 | −32,158 | −11,896 | 11/62 |
| Lock 30 / keep 60% / 15 minute cool off | 3,105 | 47.6% | 6,25,004 | 5,91,876 | +16,931 | −32,058 | −12,166 | 11/62 |
| Lock 30 / keep 60% / sell again 10 lower | 3,113 | 47.9% | 6,23,598 | 5,90,280 | +15,335 | −28,761 | −11,902 | 11/62 |
| Wide trail 15 / 100 / stop 100% | 2,878 | 44.9% | 6,16,456 | 5,86,047 | +11,102 | −26,513 | −12,445 | 14/62 |
| Lock 20 / keep 50% / Nifty +20 | 3,245 | 51.2% | 6,17,771 | 5,82,889 | +7,944 | −25,086 | −13,460 | 11/62 |
| Plain | 2,879 | 45.0% | 6,05,371 | 5,74,945 | 0 | −26,795 | −12,618 | 14/62 |
| Trail 30 / 100 / stop 50% | 2,865 | 44.2% | 5,97,142 | 5,66,934 | −8,011 | −26,510 | −11,353 | 15/62 |
ITM1
Premium about Rs 130. Every management rule beats plain holding; the 20 point lock gives the best combination of accuracy and small losses.
| Exit rule | Trades | Accuracy | Before costs | After costs | vs plain | Max drawdown | Worst month | Losing months |
|---|---|---|---|---|---|---|---|---|
| Lock 30 / keep 60% / 15 minute cool off | 3,242 | 46.8% | 7,61,741 | 7,18,389 | +37,196 | −34,299 | −15,250 | 10/62 |
| Lock 30 / keep 60% / sell again 10 lower | 3,254 | 47.2% | 7,60,304 | 7,16,703 | +35,510 | −31,621 | −17,556 | 10/62 |
| Lock 30 / keep 60% / Nifty +20 | 3,227 | 47.2% | 7,54,822 | 7,11,579 | +30,386 | −34,969 | −14,378 | 12/62 |
| Lock 20 / keep 60% / 15 minute cool off | 3,730 | 53.2% | 7,58,185 | 7,09,243 | +28,050 | −28,804 | −9,162 | 12/62 |
| Trail 30 / 100 / stop 50% | 2,876 | 42.6% | 7,43,090 | 7,04,372 | +23,179 | −33,142 | −15,024 | 11/62 |
| Lock 20 / keep 50% / Nifty +20 | 3,416 | 53.0% | 7,49,487 | 7,03,910 | +22,717 | −30,776 | −13,269 | 11/62 |
| Wide trail 15 / 100 / stop 100% | 2,879 | 42.7% | 7,31,292 | 6,92,494 | +11,301 | −33,108 | −17,173 | 12/62 |
| Plain | 2,879 | 42.7% | 7,19,997 | 6,81,193 | 0 | −33,108 | −16,701 | 12/62 |
ITM2
Premium about Rs 162. Highest profits and deepest drawdowns. The 30 point locks and the 30 / 100 / 50% trail work; the 20 point locks are too tight for this premium level.
| Exit rule | Trades | Accuracy | Before costs | After costs | vs plain | Max drawdown | Worst month | Losing months |
|---|---|---|---|---|---|---|---|---|
| Lock 30 / keep 60% / 15 minute cool off | 3,437 | 47.8% | 8,20,112 | 7,63,629 | +32,978 | −36,809 | −19,375 | 12/62 |
| Lock 30 / keep 60% / sell again 10 lower | 3,442 | 47.9% | 8,14,484 | 7,57,781 | +27,130 | −40,473 | −23,721 | 11/62 |
| Trail 30 / 100 / stop 50% | 2,879 | 41.5% | 8,00,614 | 7,51,964 | +21,313 | −40,081 | −20,502 | 12/62 |
| Wide trail 15 / 100 / stop 100% | 2,879 | 41.5% | 7,90,646 | 7,41,988 | +11,337 | −40,081 | −20,486 | 13/62 |
| Plain | 2,879 | 41.5% | 7,79,316 | 7,30,651 | 0 | −40,741 | −20,486 | 13/62 |
| Lock 30 / keep 60% / Nifty +20 | 3,368 | 48.0% | 7,85,394 | 7,29,791 | −860 | −46,492 | −18,838 | 13/62 |
| Lock 20 / keep 50% / Nifty +20 | 3,593 | 55.0% | 7,82,255 | 7,23,324 | −7,327 | −38,583 | −18,277 | 12/62 |
| Lock 20 / keep 60% / 15 minute cool off | 4,003 | 54.7% | 7,75,672 | 7,11,139 | −19,512 | −34,892 | −11,996 | 13/62 |
ITM2 hedged spread
Defined risk and a much smaller exchange margin than a naked sale (to be confirmed with the broker), at the cost of four orders per trade. Profit locks were not tested on the spread.
| Exit rule | Trades | Accuracy | Before costs | After costs | vs plain | Max drawdown | Worst month | Losing months |
|---|---|---|---|---|---|---|---|---|
| Trail 30 / 100 / stop 50% | 2,878 | 40.6% | 8,03,447 | 7,51,132 | +21,557 | −38,169 | −19,055 | 14/62 |
| Wide trail 15 / 100 / stop 100% | 2,878 | 40.6% | 7,91,933 | 7,39,613 | +10,038 | −38,546 | −19,045 | 14/62 |
| Plain | 2,878 | 40.6% | 7,81,904 | 7,29,575 | 0 | −38,169 | −19,045 | 14/62 |
Source: Arko's Strategy Research. Hypothetical backtest, weekly Nifty options, 11 Oct 2021 to 9 Nov 2026, 1 lot, statutory costs, zero brokerage. Accuracy = trades profitable before costs.
Stability across years
The table shows profit for the recommended configurations and their plain references in each calendar year. Trailing stops tend to add a small amount in most years. Profit locks redistribute profit across years: they gain strongly in some years (notably 2022) and give back part of it in others, which is why they beat plain holding in only three to five of the six years despite higher totals.
Each cell is before costs / after costs, Rs, 1 lot.
| Configuration | 2021* | 2022 | 2023 | 2024 | 2025 | 2026* |
|---|---|---|---|---|---|---|
| ITM1, plain | 70,652 / 69,254 | 1,34,938 / 1,27,464 | 67,362 / 62,315 | 68,668 / 64,306 | 1,90,459 / 1,80,236 | 1,87,918 / 1,77,618 |
| ITM1, lock 20 / keep 60% / 15 minute cool off | 68,568 / 66,814 | 1,66,765 / 1,57,622 | 55,558 / 49,659 | 70,975 / 65,244 | 2,15,096 / 2,02,133 | 1,81,223 / 1,67,770 |
| ITM1, lock 30 / keep 60% / 15 minute cool off | 69,285 / 67,691 | 1,76,252 / 1,68,188 | 74,532 / 69,279 | 74,141 / 69,104 | 1,82,884 / 1,71,350 | 1,84,646 / 1,72,778 |
| ITM1, lock 20 / keep 50% / Nifty +20 | 72,668 / 71,083 | 1,54,035 / 1,45,454 | 55,270 / 49,760 | 78,464 / 73,145 | 2,09,940 / 1,97,913 | 1,79,111 / 1,66,555 |
| ITM1, trail 30 / 100 / stop 50% | 71,118 / 69,719 | 1,39,880 / 1,32,428 | 71,188 / 66,157 | 79,194 / 74,838 | 1,90,995 / 1,80,773 | 1,90,716 / 1,80,456 |
| ATM, plain | 61,640 / 60,580 | 1,17,320 / 1,11,398 | 44,862 / 41,276 | 61,392 / 57,912 | 1,58,758 / 1,50,801 | 1,61,398 / 1,52,978 |
| ATM, lock 20 / keep 60% / 15 minute cool off | 63,290 / 62,034 | 1,41,560 / 1,34,526 | 49,040 / 45,165 | 55,074 / 50,699 | 1,65,384 / 1,55,807 | 1,64,756 / 1,54,228 |
| ATM, wide trail 15 / 100 / stop 100% | 61,640 / 60,580 | 1,23,788 / 1,17,869 | 43,428 / 39,850 | 62,758 / 59,278 | 1,60,156 / 1,52,200 | 1,64,687 / 1,56,270 |
| ATM+1 (OTM1), plain | 52,355 / 51,555 | 94,930 / 90,246 | 27,508 / 24,976 | 50,412 / 47,632 | 1,31,390 / 1,25,149 | 1,39,822 / 1,32,920 |
| ATM+1 (OTM1), lock 20 / keep 60% / 15 minute cool off | 54,950 / 54,040 | 1,20,538 / 1,15,195 | 32,360 / 29,759 | 53,656 / 50,360 | 1,26,574 / 1,19,449 | 1,48,626 / 1,40,242 |
| ATM+2 (OTM2), plain | 42,190 / 41,584 | 77,915 / 74,205 | 18,682 / 16,896 | 42,284 / 40,061 | 1,08,004 / 1,03,062 | 1,09,837 / 1,04,148 |
| ATM+2 (OTM2), wide trail 15 / 100 / stop 100% | 42,240 / 41,634 | 81,485 / 77,778 | 18,522 / 16,735 | 44,866 / 42,645 | 1,11,056 / 1,06,116 | 1,10,494 / 1,04,805 |
| ITM2, lock 30 / keep 60% / 15 minute cool off | 74,572 / 72,444 | 1,83,058 / 1,72,580 | 82,210 / 74,734 | 85,450 / 79,006 | 1,90,988 / 1,75,953 | 2,03,834 / 1,88,911 |
| ITM2 hedged spread, trail 30 / 100 / stop 50% | 74,860 / 72,969 | 1,49,018 / 1,39,065 | 75,548 / 68,512 | 80,964 / 75,177 | 2,14,883 / 2,01,073 | 2,08,176 / 1,94,335 |
* 2021 from 11 October; 2026 to 6 November. Hypothetical backtest, weekly Nifty options, 1 lot, statutory costs, zero brokerage.
Approaches that did not work
After costs unless noted.
| Approach | Result (1 lot) | Why |
|---|---|---|
| Lock at 20 points, keep 50%, sell again 5 points lower (unlimited), ITM1 | Rs −28,000 vs plain | Each reentry is at a worse price; whipsaws on range bound days |
| Any profit lock without reentry | Rs −1.2 to −1.6 lakh | Removes the long overnight runs that generate the profit |
| Reentry on a new Nifty extreme, a new premium low, after 30 minutes, or next session | Negative at nearly all settings | Reentry is too late or follows overnight gaps |
| Fixed profit targets of 30% / 50% / 70% | Rs −26,000 to −2.3 lakh | Caps winners |
| Daily profit target or daily loss limit | Rs −7,000 to −2.6 lakh | Caps winners; stops trading before recoveries |
| Tight stop loss (20% to 40% of premium) | Rs −10,000 to −53,000 | Closes trades that later recover |
| The script’s own index based trailing profit | Rs −2,000 to −13,000 | Trails the index, not the option |
| Skipping expiry day entries | Rs −2.1 lakh | Expiry day trades are the most profitable group |
| Selling only calls or only puts | Rs −2.3 lakh / −4.3 lakh | Both sides contribute |
| Deeper in the money (ITM3 and beyond) | Rs +0.9 to 1.1 lakh | Worst month Rs −24,000 and drawdown Rs −46,000: risk rises faster than return |
Source: Arko's Strategy Research. Hypothetical backtest, 1 lot. These results come from the wider research programme on data from 11 October 2021 to 28 October 2026; profit target and daily limit results use data to 16 October 2026 and are before costs.
Discussion
Where the profit comes from
Profit in this programme is concentrated. On ITM1 held plain, the 465 positions carried overnight earned Rs 8,91,794, while the remaining same day trades lost Rs 2,10,601 in aggregate. Accuracy is low (about 42%) because many trades are small losses that are cut quickly by the next signal; a minority of long, trending positions pays for them. Any rule that closes positions early and permanently, whether a profit target, a tight stop or a lock without reentry, removes exactly those positions. This explains why all such rules reduced profit.
Why locks with reentry work
A ratcheting lock converts a winning trade that later reverses into a smaller win instead of a loss, which raises accuracy. On its own it would also close the long winners. The cool off reentry repairs this: if the premium is still lower 15 minutes after the lock exit, the move has resumed and the position is opened again, so the seller remains exposed to the trend. The 15 minute delay filters out most of the immediate reversals that make faster reentry rules (selling again a few points lower) unprofitable. The cost is a large increase in the number of orders and a less even distribution of returns across years.
Why wide trails are preferable to tight ones
Trailing stops fired on only a few dozen to a few hundred of roughly 2,880 trades. Their value is as insurance against a sold option that rises sharply, not as a profit taking device. Wide settings (a rebound of 100 points, a stop 50% to 100% above the sale price) remove the worst outcomes while leaving normal fluctuations alone; settings with stops of 20% to 40% or rebounds under 50 points closed too many trades that would have recovered.
Strike depth and risk
Profit after costs divided by maximum drawdown is 20.5 for ATM+2 (OTM2), 21.2 for ATM+1 (OTM1), 21.5 for ATM, 20.6 for ITM1 and 17.9 for ITM2. From ATM+2 to ITM1 the ratio is nearly constant: deeper strikes simply scale both profit and risk. Beyond ITM1 the ratio deteriorates, and ITM3 and deeper strikes added risk faster than return. Strike choice is therefore primarily a position sizing decision, and ATM or out of the money strikes are a reasonable choice for smaller accounts.
Configuration profiles
The report describes six configurations and the trade offs of each. They show how each configuration behaved in the backtest; they are not a recommendation to trade any of them.
Profile A: ITM1, lock 20 / keep 60% / 15 minute cool off (balanced)
How a trade behaves. ITM1 is sold on the signal. Once 20 points are in profit the lock trails to keep at least 60% of the peak. After a lock exit the same strike is sold again if the premium is still lower 15 minutes later, so long trends are kept.
| Profit after costs | Accuracy | Trades | Avg win / avg loss | Max drawdown | Worst trade / month | Losing months | Longest losing streak |
|---|---|---|---|---|---|---|---|
| 7,09,243 (+28,050 vs plain) | 53.2% (plain 42.7%) | 3,730 | 1,386 / −1,170 | −28,804 | −10,763 / −9,162 | 12 of 62 | 12 trades |
Suits a higher share of winning trades and smaller bad months without giving up profit. Consider about 850 additional trades (around 1,700 orders) over five years; it needs automation or close monitoring. Beat plain holding in 3 of 6 years.
Profile B: ITM1, lock 30 / keep 60% / 15 minute cool off (maximum ITM1 profit)
How a trade behaves. As Profile A, with the lock arming only after 30 points of profit, so fewer trades are affected.
| Profit after costs | Accuracy | Trades | Avg win / avg loss | Max drawdown | Worst trade / month | Losing months | Longest losing streak |
|---|---|---|---|---|---|---|---|
| 7,18,389 (+37,196 vs plain) | 46.8% (plain 42.7%) | 3,242 | 1,785 / −1,150 | −34,299 | −10,763 / −15,250 | 10 of 62 | 13 trades |
Suits traders for whom absolute profit matters more than accuracy. Consider that most of the advantage arose in 2022 and the drawdown is slightly above plain. On ITM2 the same rule produced the highest profit in the study.
Profile C: ITM1, trail 30% / 100 points / stop 50% (simplest rule)
How a trade behaves. A stop sits at 150% of the sale price; after a 30% fall a trailing buyback follows 100 points above the lowest premium.
| Profit after costs | Accuracy | Trades | Avg win / avg loss | Max drawdown | Worst trade / month | Losing months | Longest losing streak |
|---|---|---|---|---|---|---|---|
| 7,04,372 (+23,179 vs plain) | 42.6% (plain 42.7%) | 2,876 | 2,106 / −1,128 | −33,142 | −12,694 / −15,024 | 11 of 62 | 13 trades |
Suits a single rule that any trading platform supports. Beat plain holding in all six years. Consider that it does not raise accuracy; it trims the worst losses only.
Profile D: ATM, lock 20 / keep 60% / 15 minute cool off (retail ATM)
How a trade behaves. The ATM option is sold with the same lock and cool off reentry as Profile A.
| Profit after costs | Accuracy | Trades | Avg win / avg loss | Max drawdown | Worst trade / month | Losing months | Longest losing streak |
|---|---|---|---|---|---|---|---|
| 6,02,460 (+27,515 vs plain) | 51.6% (plain 45.0%) | 3,442 | 1,277 / −992 | −25,762 | −9,870 / −9,195 | 10 of 62 | 11 trades |
Suits traders who prefer ATM strikes: the highest ATM profit and accuracy, and the smallest ATM worst month. Consider the additional orders, as in Profile A; use limit orders on reentries.
Profile E: ATM+1, lock 20 / keep 60% / 15 minute cool off (low risk)
How a trade behaves. One strike out of the money is sold with the same lock and reentry.
| Profit after costs | Accuracy | Trades | Avg win / avg loss | Max drawdown | Worst trade / month | Losing months | Longest losing streak |
|---|---|---|---|---|---|---|---|
| 5,09,045 (+36,569 vs plain) | 51.0% (plain 46.9%) | 3,227 | 1,098 / −816 | −23,967 | −8,876 / −8,538 | 13 of 62 | 10 trades |
Suits capital preservation as the priority: drawdown about Rs 24,000 and worst month under Rs 9,000. Consider the lower profit per rupee of margin than in the money strikes.
Profile F: ATM+2, wide trail 15% / 100 points / stop 100% (lowest risk)
How a trade behaves. Two strikes out of the money are sold; buy back if the premium doubles, or on a 100 point rebound after a 15% fall.
| Profit after costs | Accuracy | Trades | Avg win / avg loss | Max drawdown | Worst trade / month | Losing months | Longest losing streak |
|---|---|---|---|---|---|---|---|
| 3,89,712 (+9,757 vs plain) | 48.5% (plain 48.6%) | 2,879 | 983 / −653 | −18,547 | −7,941 / −7,440 | 14 of 62 | 10 trades |
Suits the smallest accounts or the most cautious approach; maximum drawdown about Rs 18,500. Consider about 45% less profit than ITM1.
Selection guide
| Situation | Configuration |
|---|---|
| Best balance of profit, accuracy and small losses | Profile A |
| Maximum profit, tolerant of larger swings | Profile B, or ITM2 with the same lock |
| One simple rule on any platform | Profile C |
| Prefers ATM strikes | Profile D (or the wide trail without monitoring) |
| Low risk | Profile E |
| Lowest risk, smallest account | Profile F |
| Limited margin, dependable two leg execution | ITM2 hedged spread with trail 30 / 100 / 50% |
Operating notes from the study
- The figures assume every signal is taken, including expiry day entries, and positions are held overnight when the strategy says so.
- Adding fixed profit targets or tight stop losses on top of a chosen rule lowered results in every test.
- The report suggests holding capital of at least 1.5 times the historical maximum drawdown in addition to margin.
- Slippage matters: each additional tick costs about Rs 15,000 per lot over five years on a naked sale, and more with profit locks. Limit orders help.
Limitations
- Results are historical simulations on one minute closing prices with modelled fills; real fills, especially for lock exits and reentries, may differ.
- Liquidity on expiry day, changes in broker margin rules, taxes on profits and future changes in market structure (lot sizes, expiry days, trading hours) are not modelled.
- Margin requirements are estimates; the hedged spread’s margin benefit should be confirmed with the broker.
- Gains from management rules are modest relative to total profit and are uneven across years; profit lock rules in particular depend on market regime.
- All configurations share the same signal events; conclusions apply to managing directional option selling positions of this type.
- The configurations were picked from more than 30,000 variants. Choosing the best of many tests carries a risk of fitting the past; settings that looked best on this sample may not stay best.
Statutory charges applied
Rates for index options, by effective date.
| Charge | Rate | Applied on |
|---|---|---|
| Securities transaction tax | 0.0625% to Sep 2024; 0.10% from Oct 2024; 0.15% from Apr 2026 | Sell premium |
| Exchange transaction charge | 0.053% to Mar 2023; 0.05% to Sep 2024; 0.0355% from Oct 2024 | Premium, both sides |
| SEBI turnover fee | Rs 10 per crore (0.0001%) | Premium, both sides |
| Stamp duty | 0.003% | Buy premium |
| GST | 18% | Exchange charge and SEBI fee (and brokerage, zero here) |
| Brokerage | Zero | Not applied |
Glossary
| Term | Meaning |
|---|---|
| ATM, ITM, OTM | At the money (the strike nearest to Nifty), in the money, out of the money. ATM+1 and ATM+2 are one and two strikes OTM; ITM1 and ITM2 are one and two strikes ITM. |
| Premium | The price of the option. A seller receives it at entry and pays it at exit. |
| Point | One rupee of option premium, or one index point for Nifty levels. |
| Accuracy | The share of trades profitable before costs. |
| Maximum drawdown | The largest fall of cumulative profit from a previous peak. |
| Trailing stop | An exit rule that follows the premium’s lowest level and buys back on a rebound of a set size. |
| Profit lock | An exit rule that keeps a set share of the peak open profit once a profit threshold is reached. |
| Reentry, cool off | Selling the same strike again after a lock exit when a condition is met; a cool off waits a fixed time first. |
| Plain | Holding a position until the strategy’s close signal or expiry, with no additional rule. |
| Tick, slippage | The minimum price step (Rs 0.05), and the assumed adverse fill on each order. |
| STT | Securities transaction tax, charged on option sell premium. |
FAQ
Are these real trading results?
No. All figures are hypothetical backtest results computed on historical one minute option prices with modelled fills and costs. They do not represent actual trading, and no representation is made that any account will achieve similar results.
Is this a recommendation to sell options?
No. The report is published for education and research only. It is not investment advice, a solicitation, or a recommendation to buy or sell any security. Option selling can result in losses exceeding the premium received. Consult a SEBI registered investment adviser before trading.
Does the report show how Arko’s Strategy creates its signals?
No. The signal logic is proprietary. The study holds the signals fixed and only looks at how the sold option is managed once a signal fires.
Can I read the full report?
Yes. Download the full report (AS-RR-2026-01, PDF). The PDF (11 Nov 2026) uses the same data as this page, to 9 Nov 2026. Like this page, it is a hypothetical backtest on past data, not investment advice.