
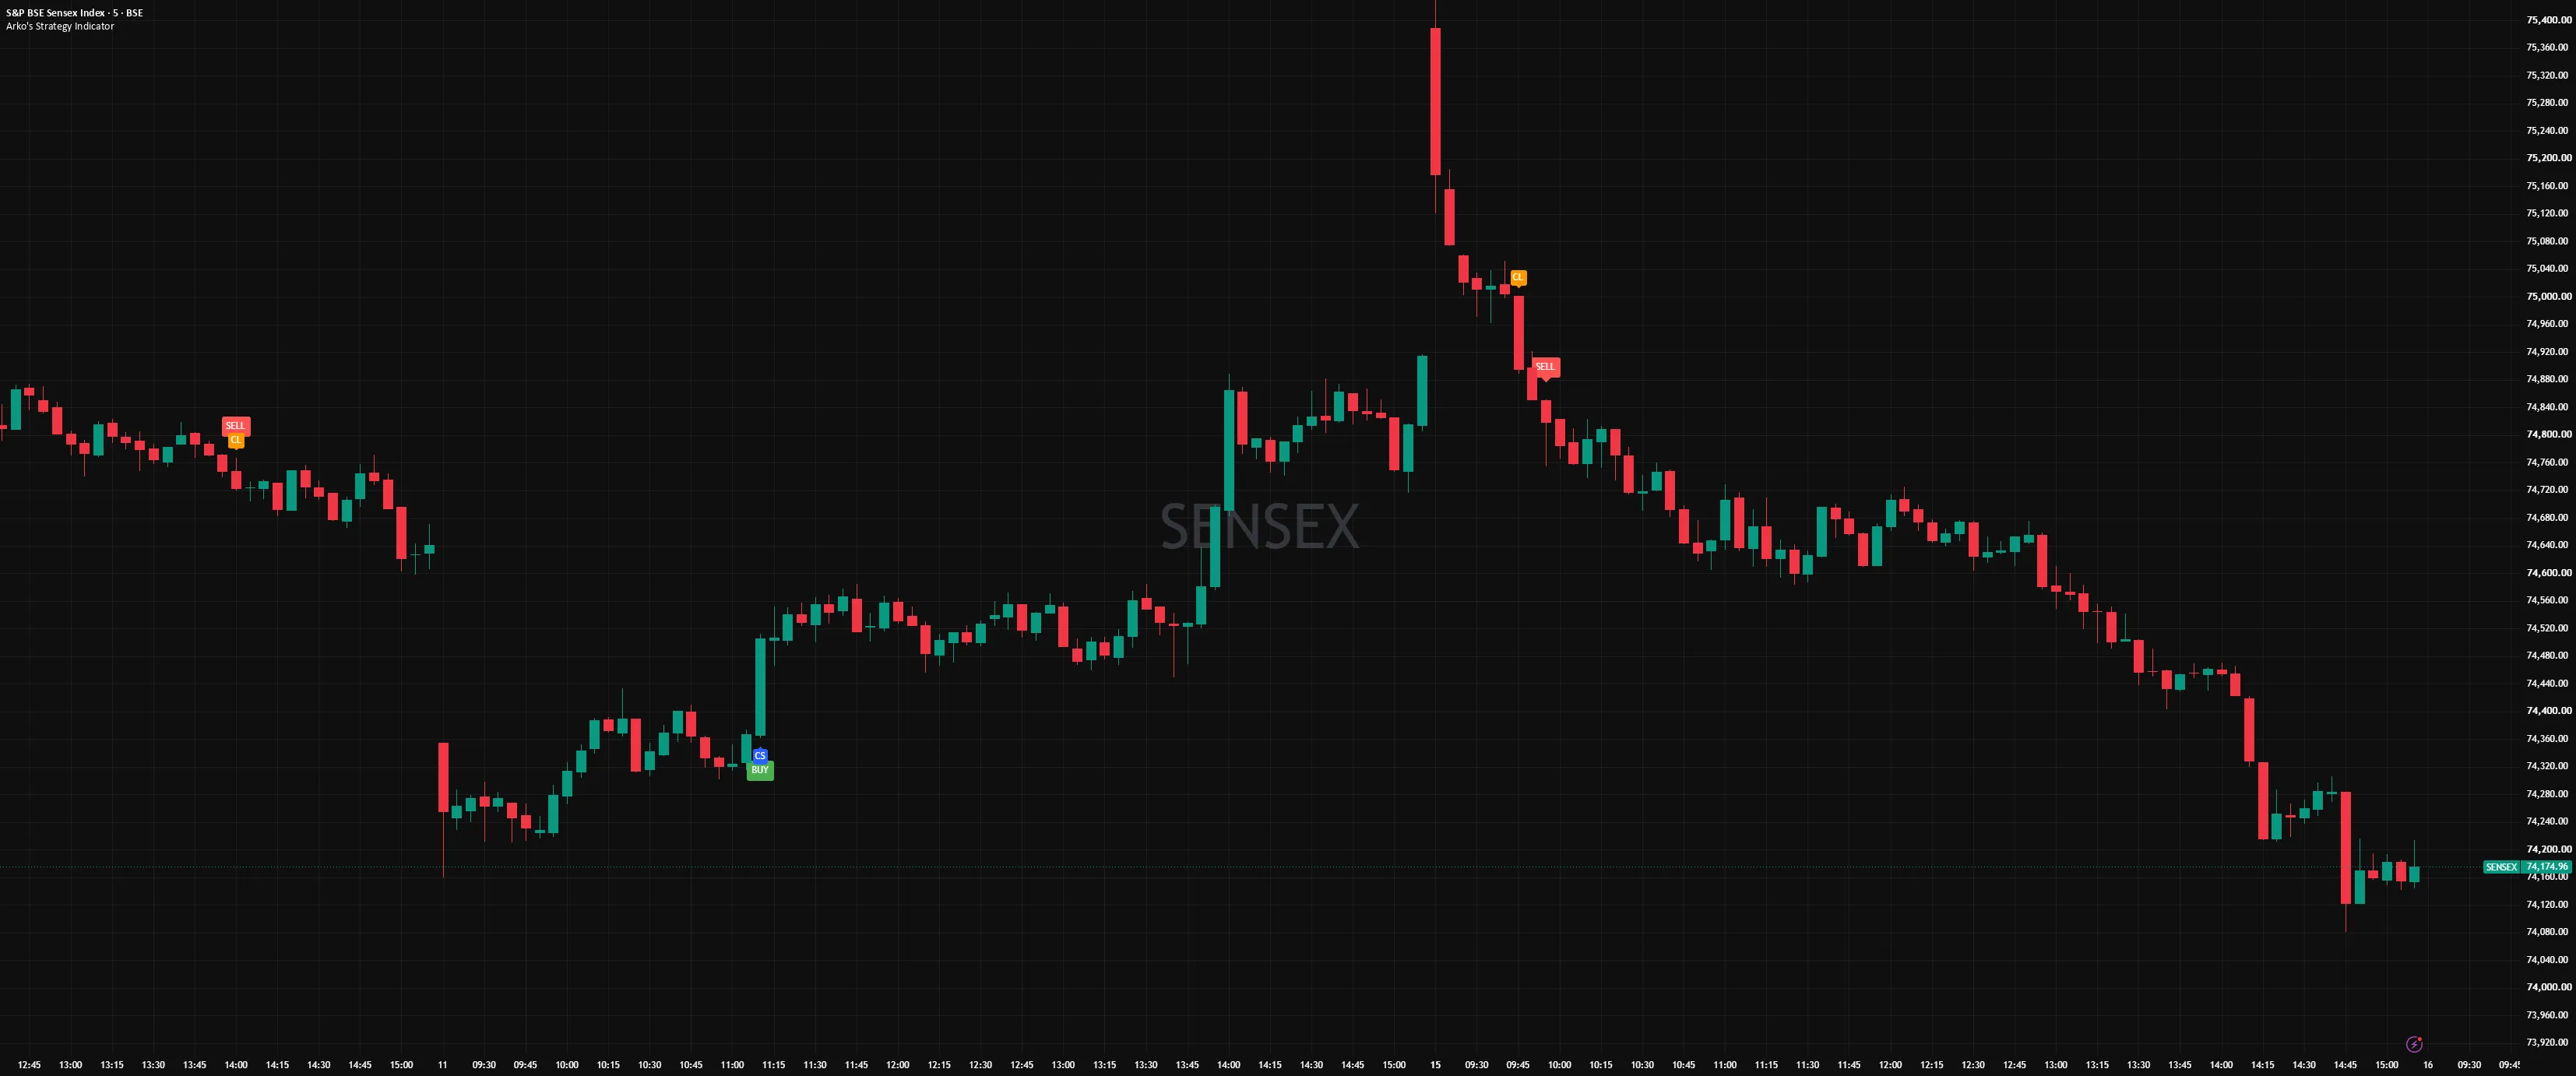






Why there are two
Arko’s Strategy comes in two versions. They give exactly the same signals; what differs is the job each one is built for.
- Arko’s Strategy: for testing. It is a TradingView strategy script, so it runs in TradingView’s Strategy Tester. Use it to backtest the signals on your market and timeframe, and to see every simulated trade, before you rely on them.
- Arko’s Strategy Indicator: for trading. It is a TradingView indicator that keeps the chart clean: just the Buy, Sell, Close Long and Close Short signals. Its alerts are built for automation, so they can go to your broker or to Vyuh.
Test with the strategy, then trade and automate with the indicator. This page covers the strategy.
Overview
Most chart based trading comes down to two questions asked again and again: when to get in, and when to get out. Answering them by eye, bar after bar, is where consistency usually breaks down. One day a setup looks convincing, the next day the same setup gets ignored, and the exit depends on mood as much as on the chart.
Arko’s Strategy gives those two questions a fixed vocabulary. It places four kinds of marker on a TradingView chart: Buy, Sell, Close Long and Close Short. Because it is published as a TradingView strategy rather than a plain indicator, TradingView can also run it over the chart’s history and show how those entries and exits would have played out, trade by trade, in the Strategy Tester.
The published description sums up the intent in its own words: “Smart Entries. Cleaner Exits. Better Clarity.” It describes a tool “designed for traders who value simplicity and discipline”, offering “a structured approach to both entering and managing positions with visual clarity on the chart” (quoted from TradingView).
Who it suits
- TradingView users who want a repeatable process. If you already chart on TradingView and want the same rules applied the same way every time, a strategy script does exactly that.
- Traders who test before they commit. The strategy runs in TradingView’s Strategy Tester, so you can study its behaviour on an index or stock before risking anything.
- Traders who plan to automate. The description says that once you like the backtesting results on an index or stock, you can automate your trades. Two of its three updates so far have been about alerts, which is how TradingView hands signals to automation tools.
Who it does not suit
- Anyone looking for tips, calls or someone else to decide for them. The strategy draws markers; every decision to trade is yours.
- Anyone who needs to read or change the code. The script is invite only and the source stays private.
- Anyone expecting a guaranteed outcome. No tool can offer that, and none is offered here.
How it works
Arko’s Strategy is a TradingView strategy script. In TradingView terms, that means it does two jobs at once:
- On the live chart, it draws its markers as new bars form, so you can see where it would enter and exit.
- On historical data, TradingView runs the same rules bar by bar from the start of the loaded history and simulates the resulting trades. The result appears in the Strategy Tester as a list of trades and summary statistics.
The published description stresses two design choices:
- It is meant to work on any chart. The description says it “works on any chart” and mentions indices and stocks specifically.
- It is meant to be set once. In the description’s words, “You won’t have to change the settings over and over again.” The idea is that you find settings you are comfortable with on a given index or stock and then leave them alone, rather than tuning them every session.
What the strategy calculates internally is not published. The script is invite only, and its logic is proprietary. This page describes only what the public TradingView description says.
Arko’s Strategy and Arko’s Strategy Indicator give the same signals. The strategy is the version for backtesting in TradingView’s Strategy Tester; the indicator is the clean version for trading, with alerts built for automation. Both use the Strength and Closing Mode inputs explained on the Indicator’s page.
How to read it on the chart
The four markers
| Marker | What it means on the chart |
|---|---|
| Buy | The strategy opens a long position in its simulation. |
| Sell | The strategy opens a short position in its simulation. |
| Close Long | The strategy exits an open long position. |
| Close Short | The strategy exits an open short position. |
A Sell marker never closes an open long by itself. The long is always closed first by a Close Long marker; the Sell then comes after it, or on the same bar as the Close Long.
These markers are the output of a set of rules. They are not recommendations, and they say nothing about whether a trade will make or lose money.
Inputs and settings
Inputs tab
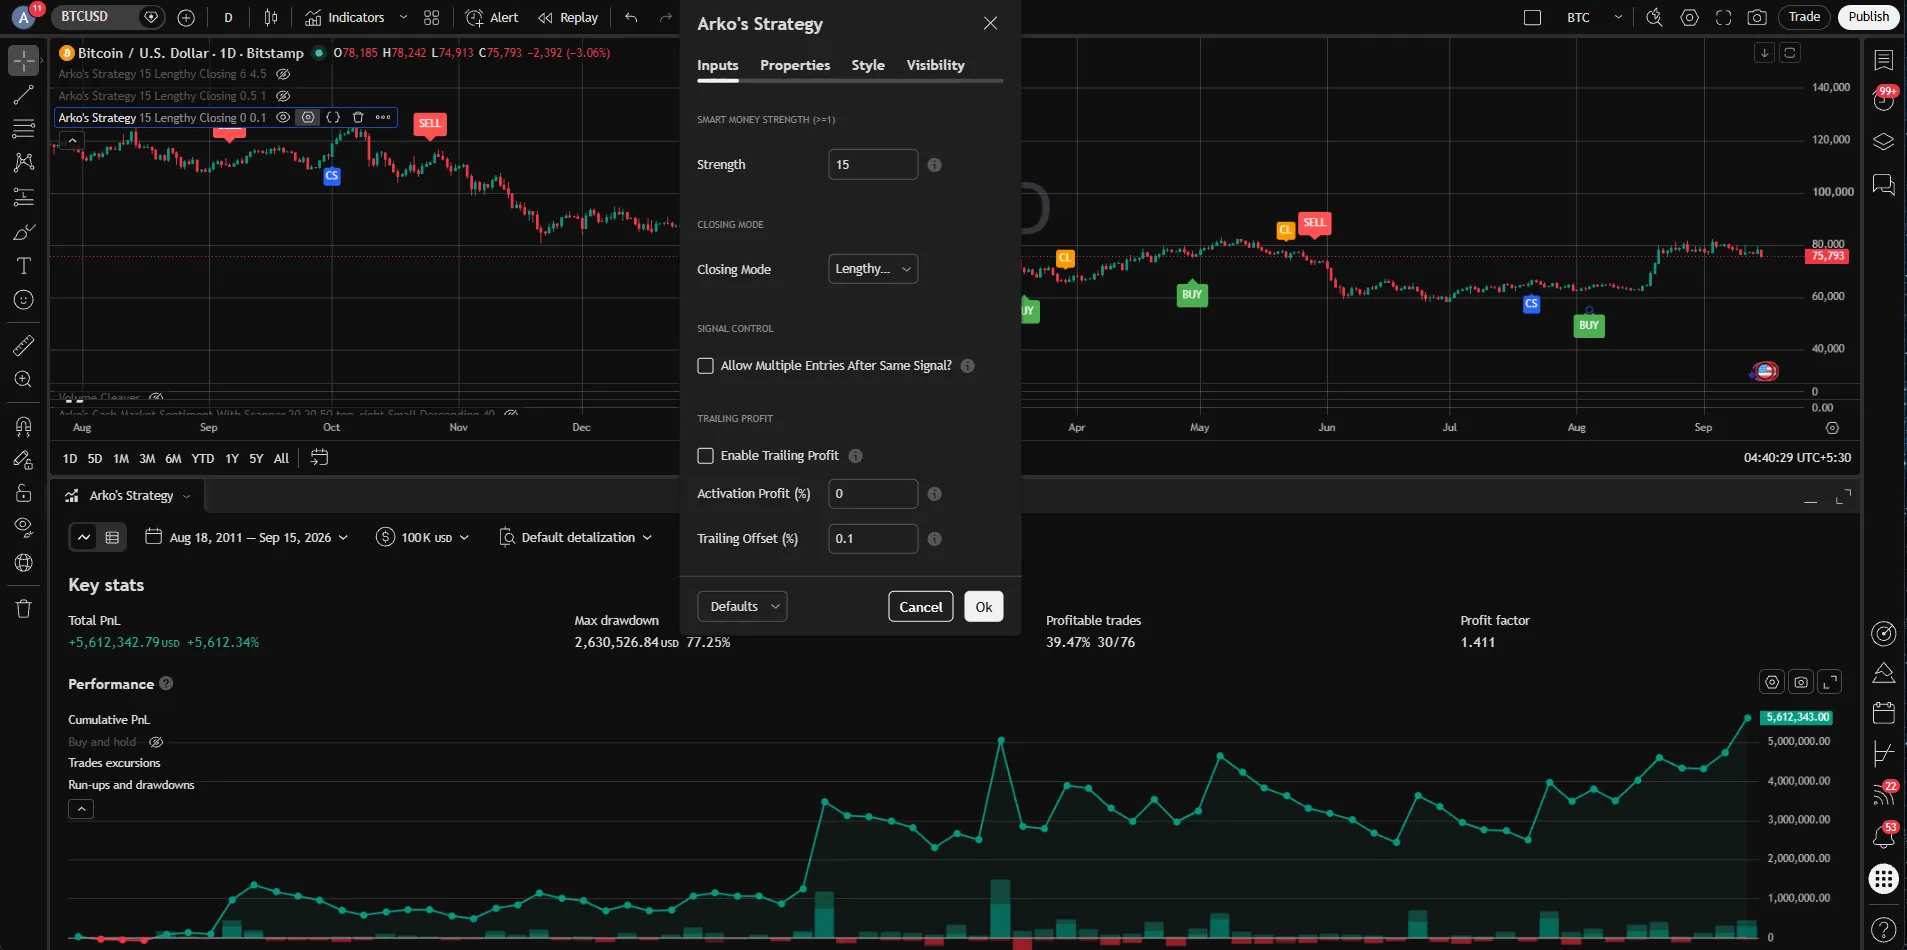
| Setting | Default | What it does |
|---|---|---|
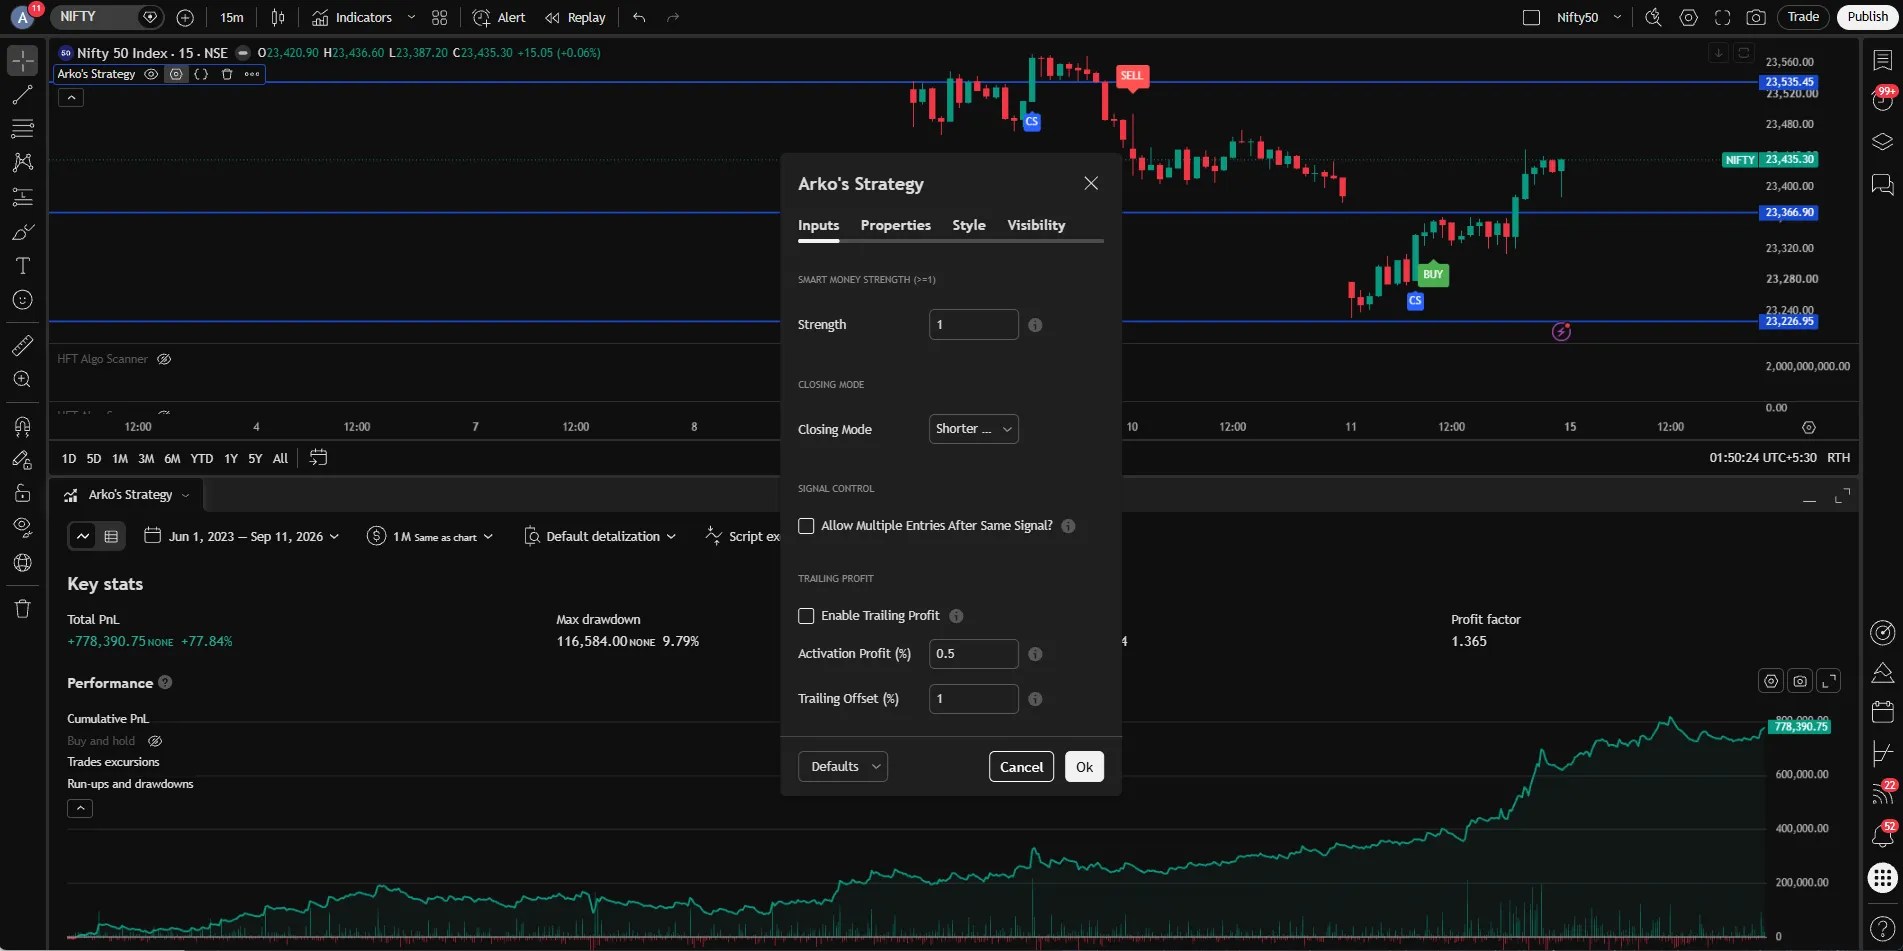
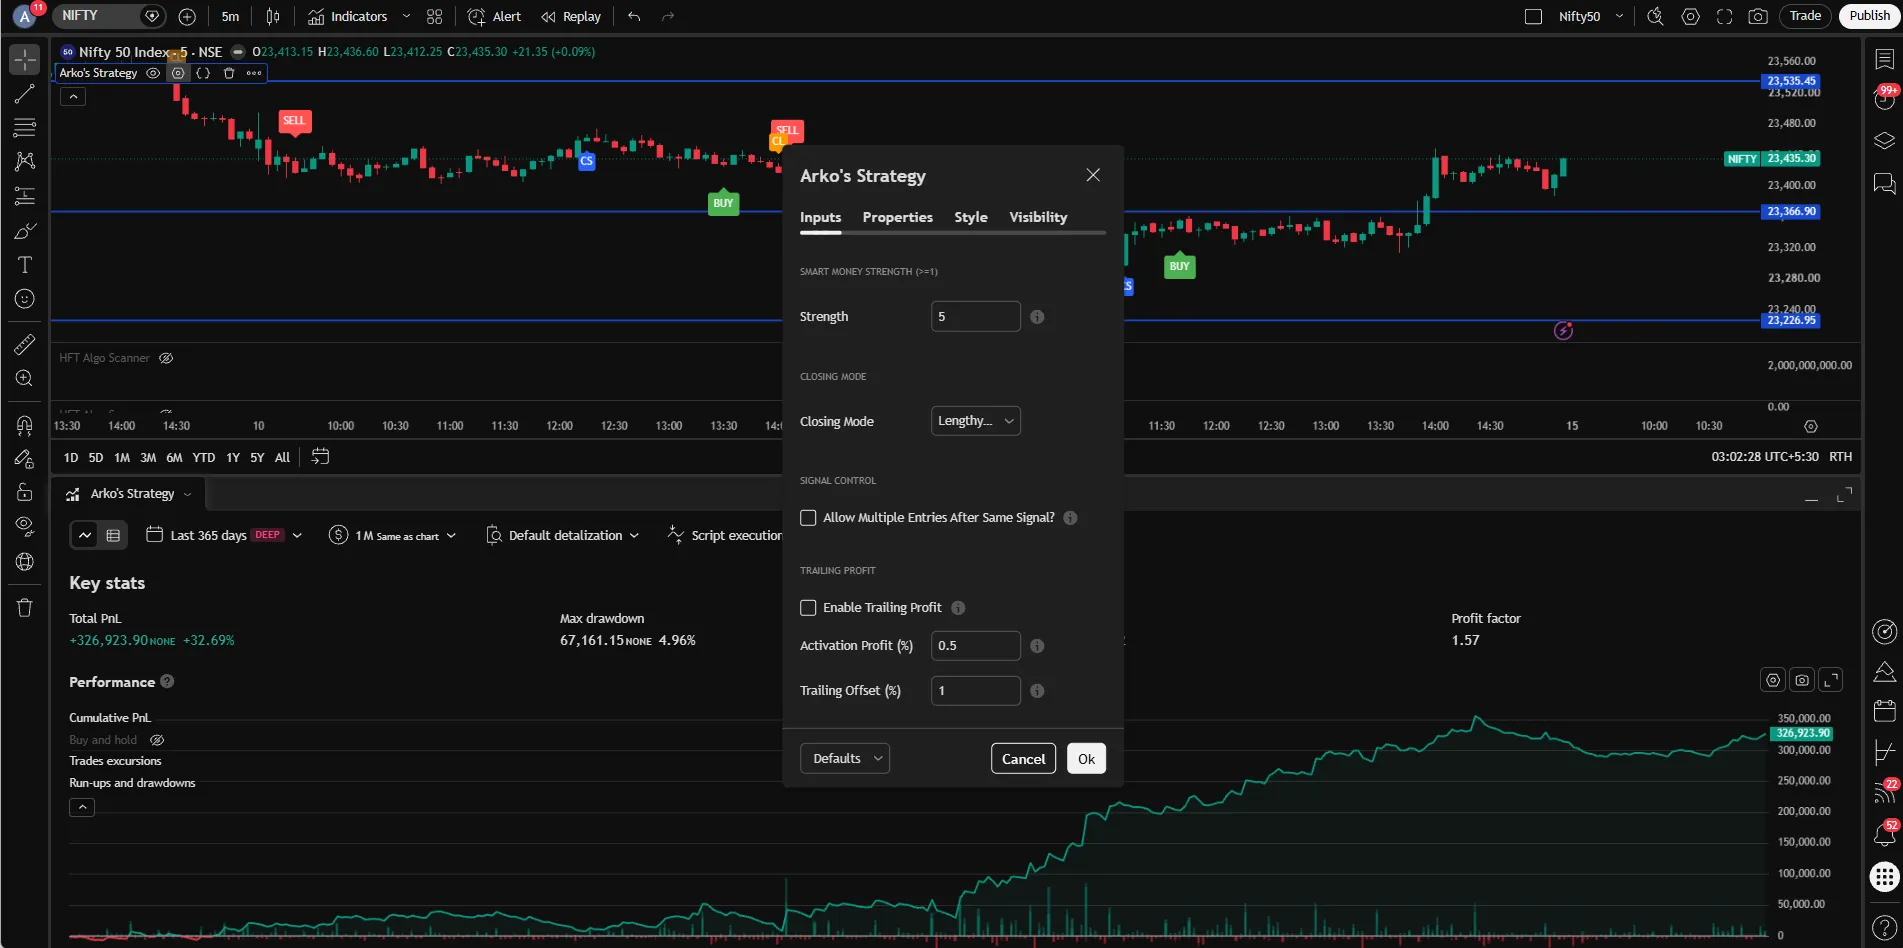
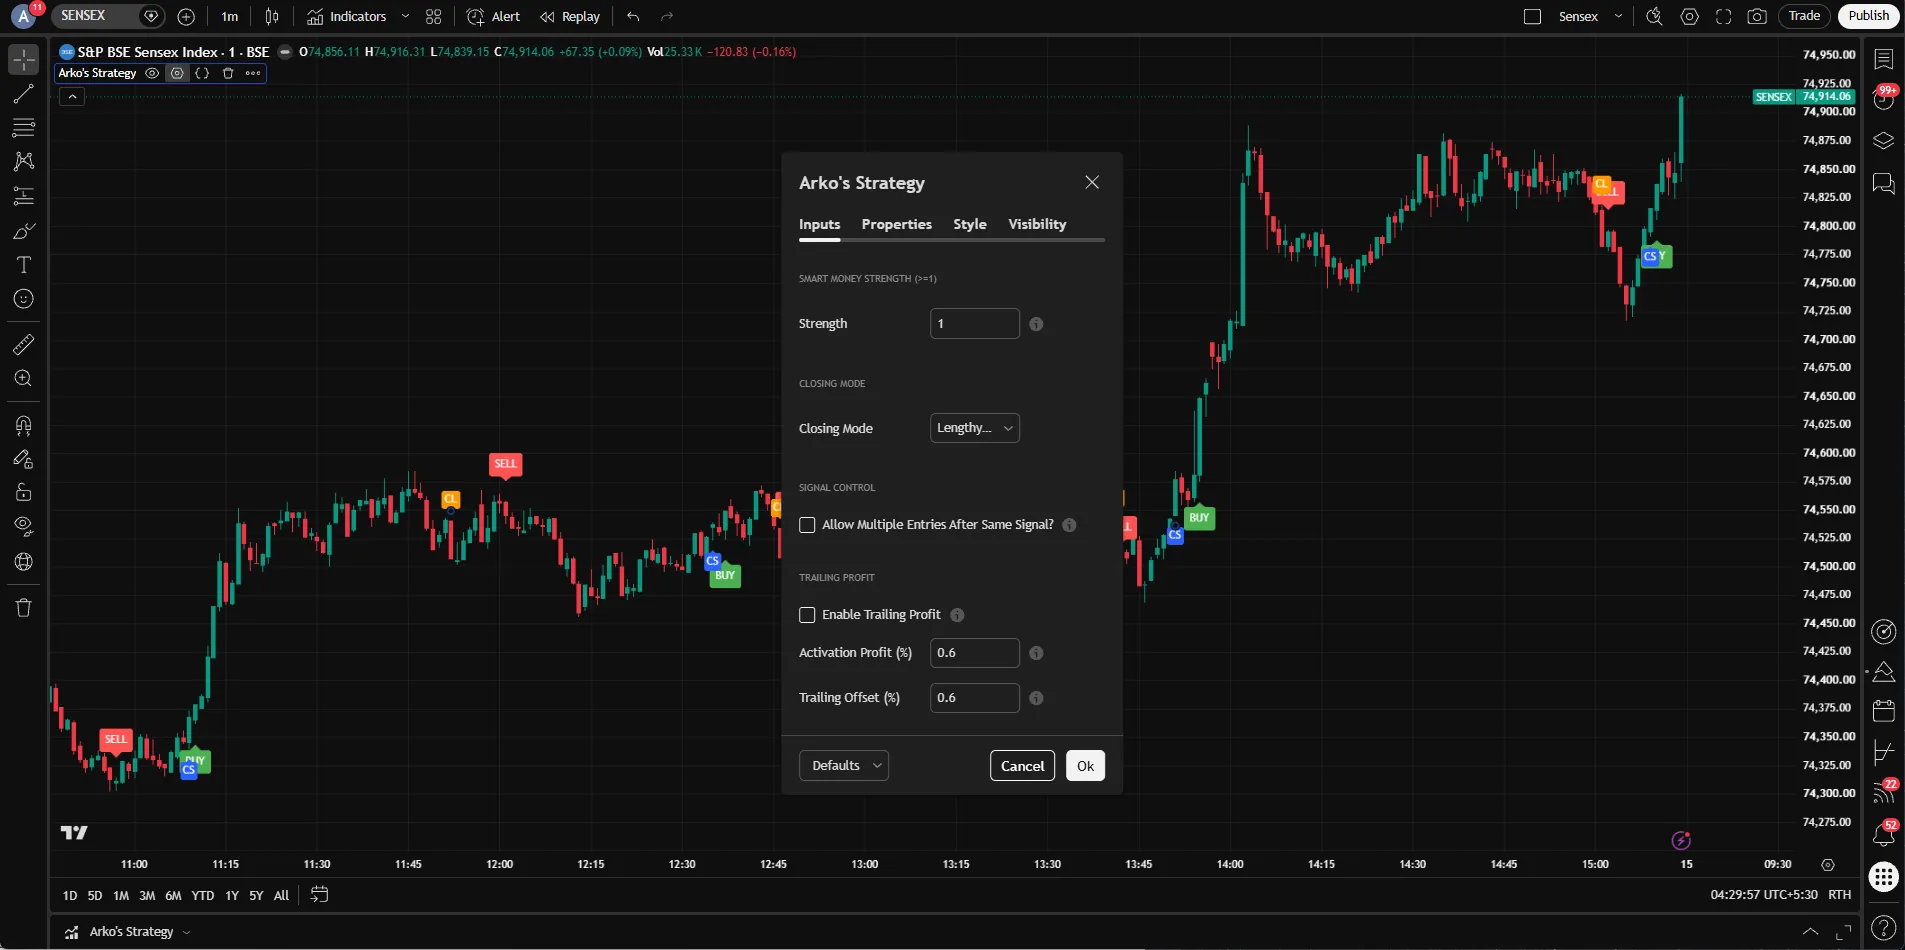
| Strength (smart money strength, 1 or more) | 5 | How much confirmation it waits for before a marker. Explained on the Arko’s Strategy Indicator page. |
| Closing Mode | Shorter Closing | Whether exits come early (shorter) or hold for a longer move (lengthy). Explained on the Indicator page. |
| Allow Multiple Entries After Same Signal? | Off | Whether it can enter again on a repeat of the same signal. |
| Enable Trailing Profit | Off | Turns on a trailing profit exit. |
| Activation Profit (%) | 0.5 | The profit, in percent, at which the trail starts. |
| Trailing Offset (%) | 1 | How far, in percent, the trail stays behind. |
Choosing your settings. Set the inputs as the Arko’s Strategy guide (PDF) suggests for your market and timeframe, or pick them from the backtest results on the research pages, which test many combinations of strength, closing mode, strike and exit on Nifty options. The defaults, Strength 5 with Shorter Closing, are the signal setting those reports use on the 5 minute chart.
Properties tab (TradingView’s backtest settings)
| Setting | Default |
|---|---|
| Initial capital | 1,000,000, in the chart’s currency |
| Default order size | 100% of equity |
| Pyramiding | 1 |
| Bar detalization | Default (4 ticks per bar) |
| Script execution | On bar close |
| Commission | 0% |
| Slippage | 1 tick |
| Limit order execution | Requested price |
| Order execution delay | None |
Commission starts at zero, so set your own brokerage and charges before reading any backtest (see Reading the Strategy Tester).
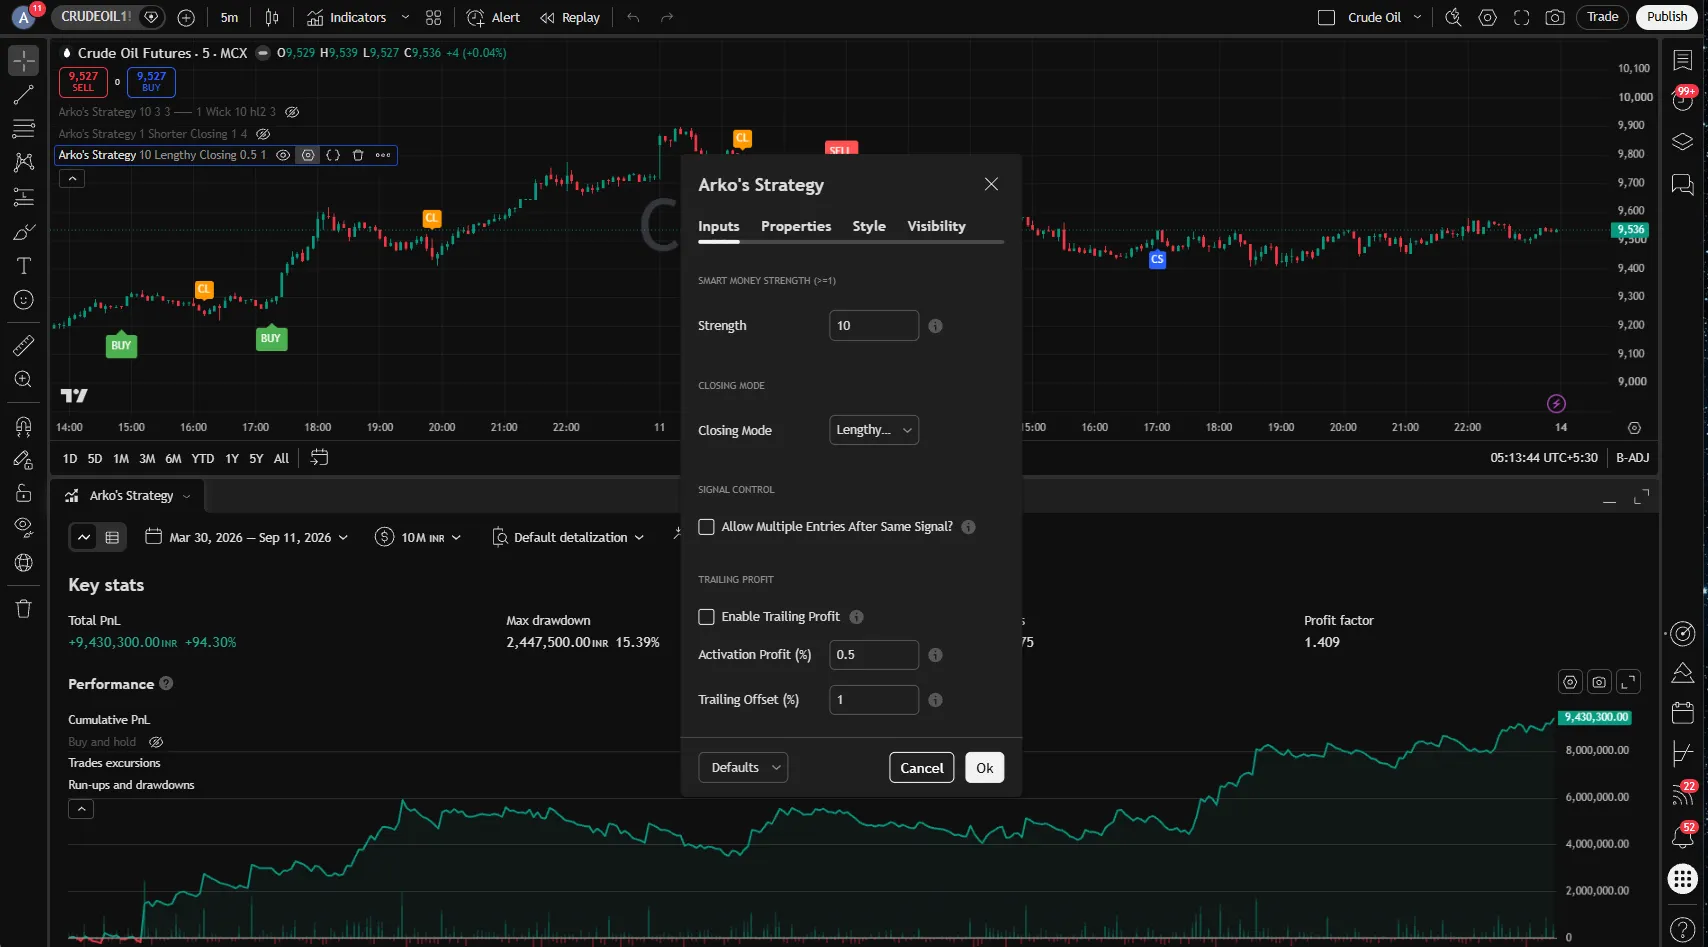
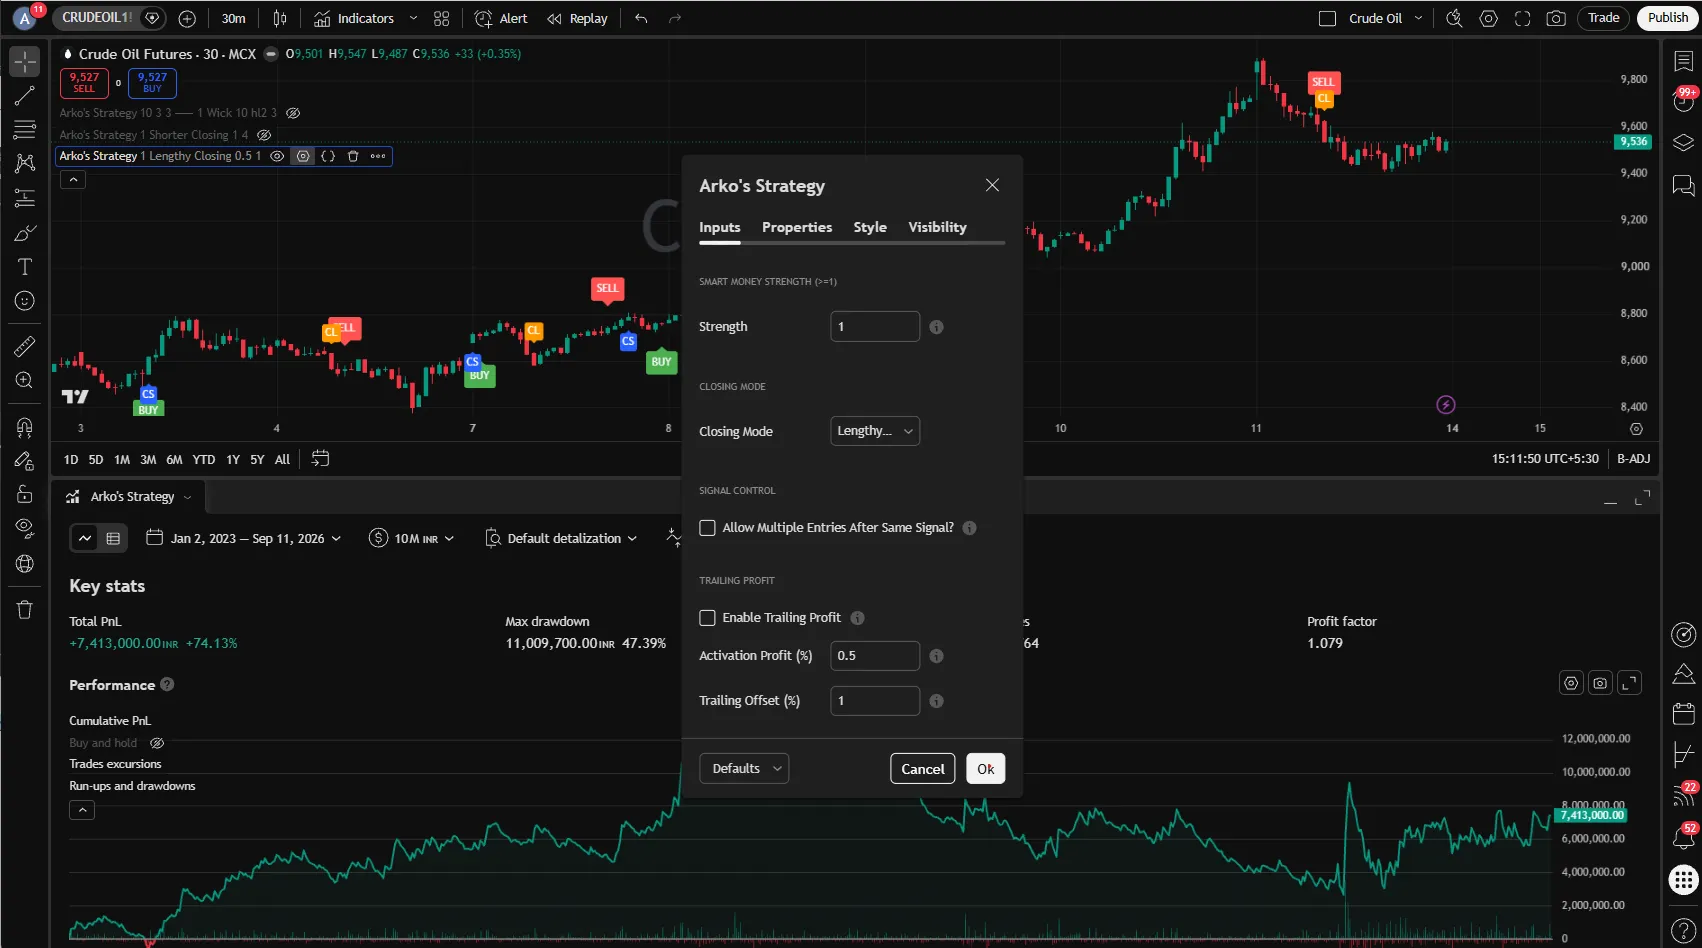
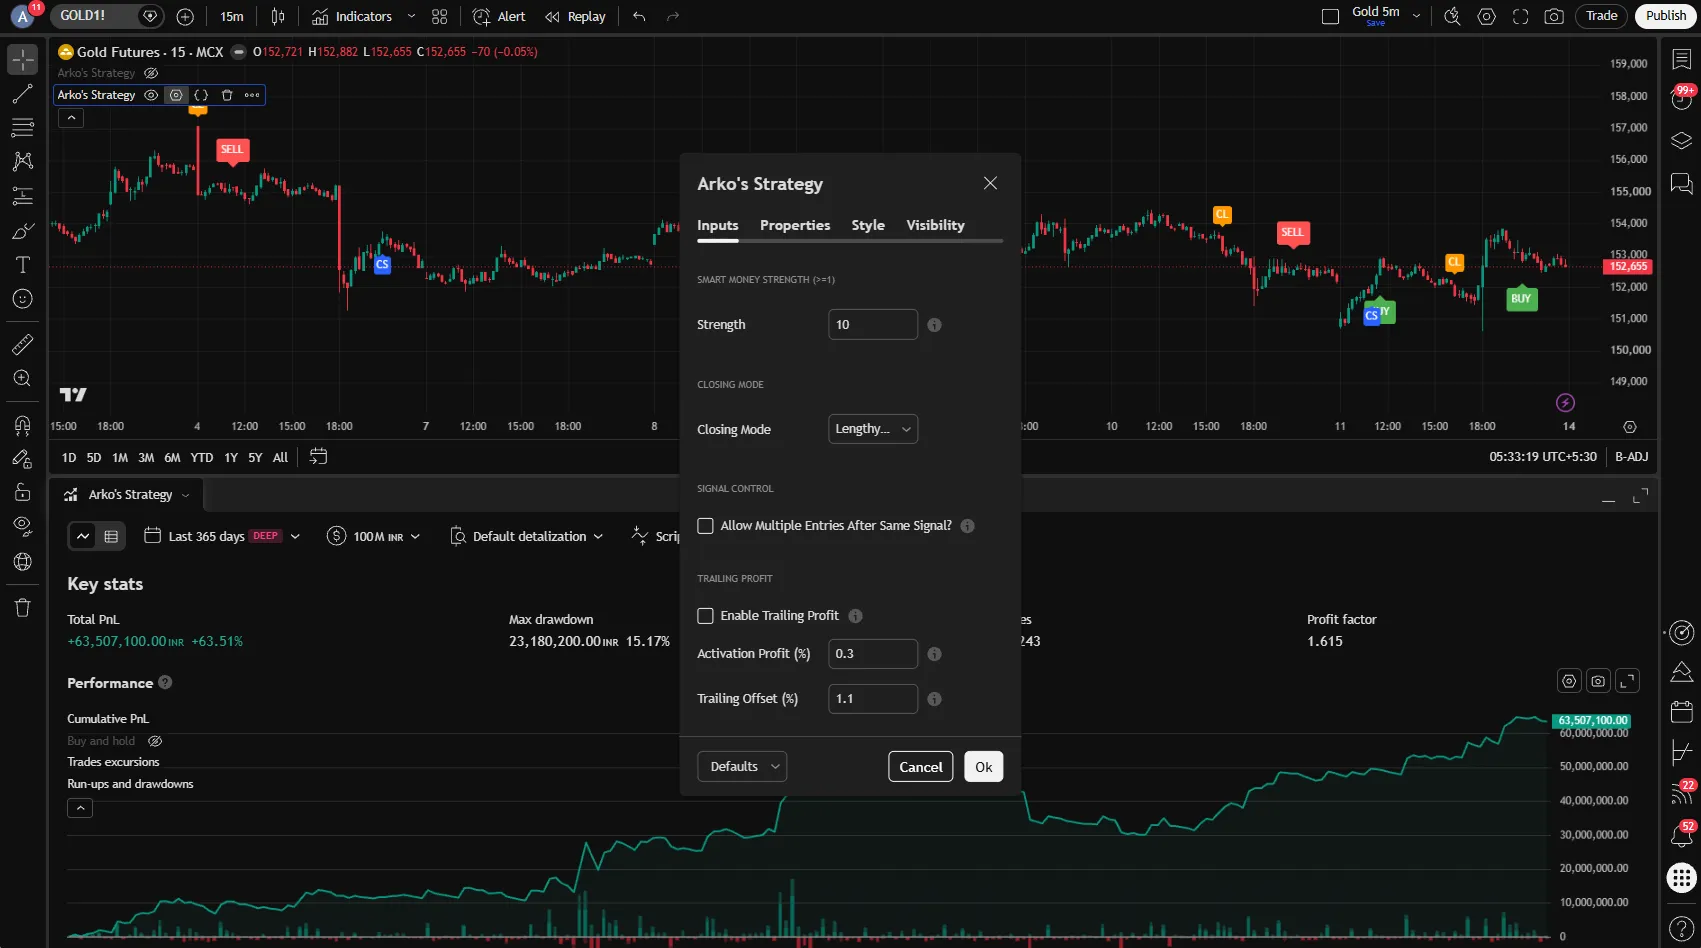
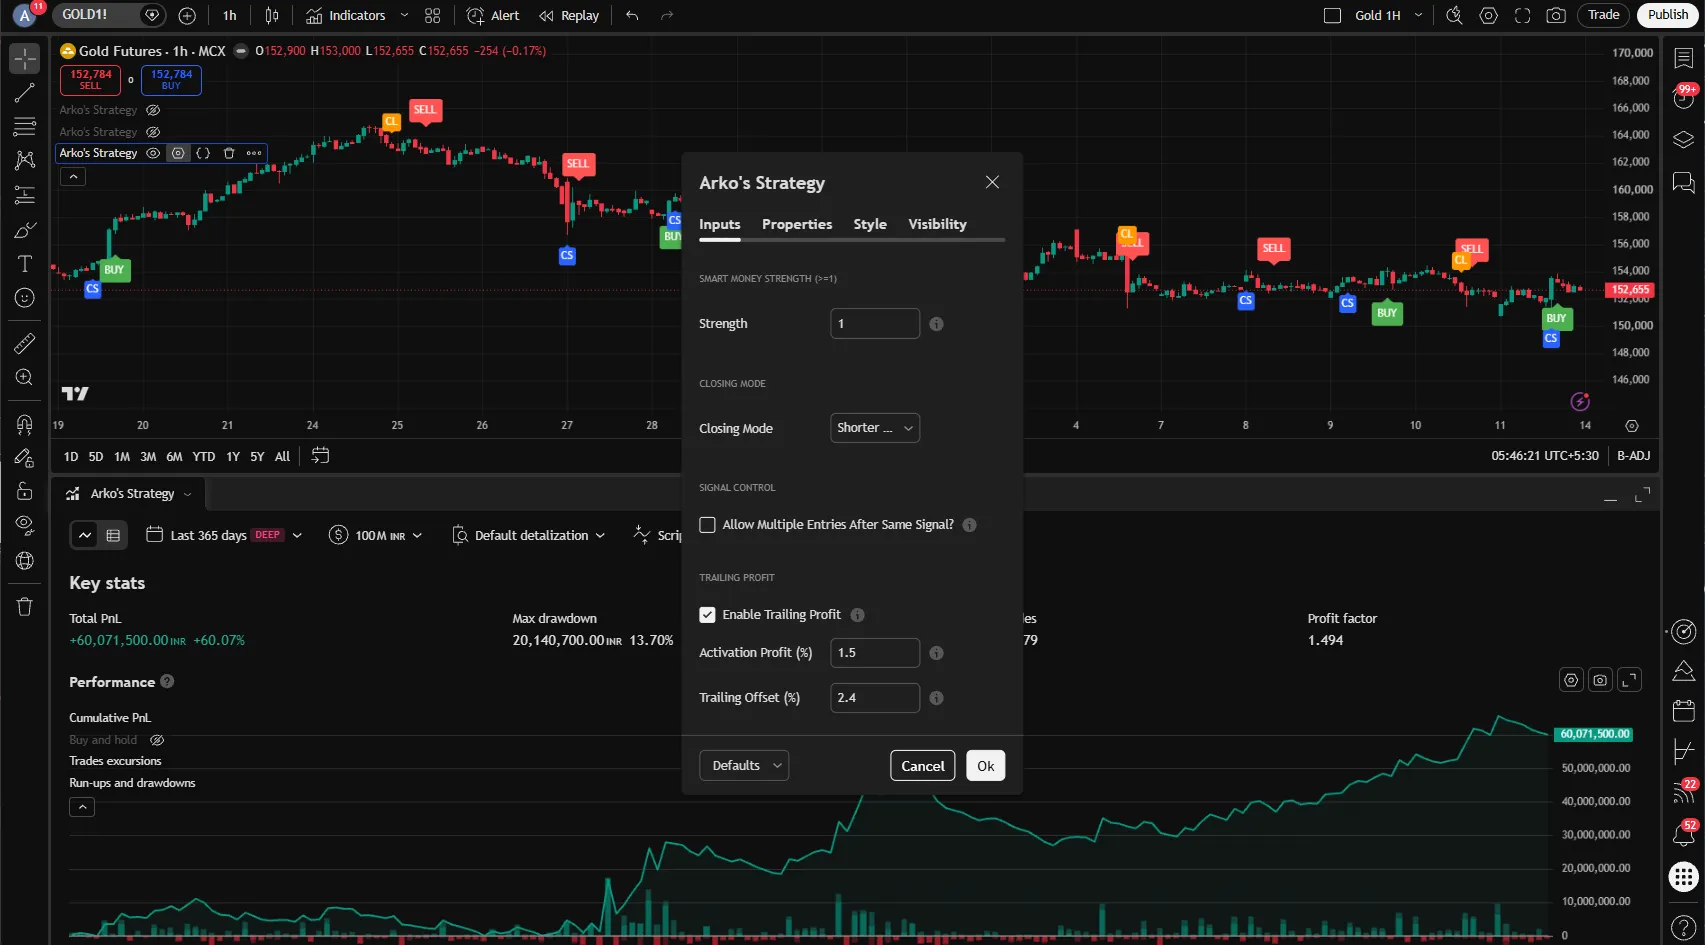
Settings by market, from the PDF guide. Strength between 1 and 15 suits most charts; on 30 minute and higher timeframes, keep it between 1 and 6 (1 or 2 on a 30 minute chart). Lengthy Closing is the usual choice; Shorter Closing exits earlier and gives more trades.
| Market | Timeframe | Suggested settings |
|---|---|---|
| Nifty | 15, 5 and 1 minute | 1 minute for scalping. |
| Sensex | 15 and 5 minute | Either closing mode; Lengthy Closing gives fewer trades. For scalping, 1 minute with Strength 1 and Lengthy Closing. |
| Bank Nifty | 5 minute | Strength 1 or 5. |
| Crude oil (MCX) | 5 minute | Strength 10 with Lengthy Closing; Strength 5 for more signals. Also 30 minute. |
| Gold (MCX) | 5, 15, 30 minute, 1 and 4 hour | See the PDF. |
| Silver (MCX) | 5 and 15 minute | Lengthy Closing with Strength 1 or 3. On 30 minute, either closing mode. Also 1 and 4 hour. |
| Bitcoin | 15 minute, 30 minute, 1 and 4 hour, 1 day | 15 minute for manual trading, Strength 6 for automation. 30 minute: Strength 17 or 29. 4 hour: Strength 11, or 1. On 1 day it trades rarely. |
These are starting points from the guide’s backtests, not a promise of results. Check them in the Strategy Tester on your own market first.
Colours and plots
| Marker | Colour | Where |
|---|---|---|
| Buy | Green | Below the bar |
| Sell | Red | Above the bar |
| Close Long | Orange | Above the bar |
| Close Short | Blue | Below the bar |
TradingView’s own Trades on chart, Signal labels and Quantity are switched off by default in the Style tab, which keeps the chart to these four markers. Every colour and position can be changed there.
Timeframes
It works on any timeframe. We choose the timeframe from the backtests: run it in the Strategy Tester on your market, or read the research reports, and use the timeframe that held up best there. The Nifty reports, for example, compare 3, 5, 10, 15 and 30 minute charts.
Markets
Trade Indian indices and stocks, MCX commodities, crypto and US markets. It works on almost any chart.
Reading the Strategy Tester
Because this is a strategy, the most useful view is often the Strategy Tester panel under the chart. A few habits make its numbers more honest:
- Set realistic properties first. In the strategy’s settings, the Properties tab lets you set order size, commission and slippage. Leaving commission at zero makes almost any backtest look better than real trading would be.
- Look at the list of trades, not just the summary. Check where entries and exits actually land on the chart and whether you could realistically have taken those trades.
- Test more than one period. Settings that look good on one stretch of history may behave very differently on another.
- Remember what a backtest is. Backtest results are hypothetical. Past performance is not indicative of future results.
If you trade options from index signals
Many traders read signals on the index chart and then trade options. The companion Indicator’s description makes an important point that applies here too: you may want to use your own trailing profit or exit rules “because options premiums might move differently” (quoted from TradingView). A marker on the index chart does not tell you how a particular option premium will behave.
Getting started
- Get access. Choose a plan on the pricing page and pay online. The order form asks for your TradingView username; we never ask for your TradingView password.
- Access arrives by itself. Once the payment goes through, the script is added to your TradingView username automatically, usually within a few minutes, and we email you when it’s done.
- Add it to a chart. Open a chart on TradingView, click Indicators, open the Invite-only scripts section and choose Arko’s Strategy.
- Open the Strategy Tester. Pick the index or stock you actually trade and a timeframe you actually use. Set commission, slippage and order size in the Properties tab before reading any results.
- Watch it live before you act on it. Spend some sessions just watching how markers appear as bars form, or use TradingView’s paper trading, before any real money is involved.
- Only then think about alerts or automation. If you set up alerts, test them with small quantities first. Automation software such as Vyuh can pass TradingView alerts to your own broker account, but every order sent is your responsibility, and broker and SEBI rules on API and algorithmic orders apply.
For automation, use Arko’s Strategy Indicator: it gives the same signals, and its Buy, Sell, Close Long and Close Short alerts are built for automation. Keep the strategy for backtesting.
Strengths and limitations
An honest look at what this tool does well and where its limits are.
Strengths
- A clear, small vocabulary. Four markers, each with one meaning. There is little room for misreading the chart.
- Testing built in. As a TradingView strategy, it can be studied in the Strategy Tester on any instrument and period you choose, before any money is at risk.
- Settings meant to stay put. The description says you won’t have to change the settings over and over, which helps avoid the habit of constant retuning.
- Actively maintained alerts. Two of the three updates in its first month were about alerts (“More specific alerts”, “More Alert system”), which matters if you plan to automate.
- Broad coverage. The description says it works on any chart, with indices and stocks named.
Limitations
- Settings live in the PDF guide. Inputs, suggested settings by market, alerts and automation are explained in the PDF guide, not on the TradingView page.
- Closed code. The script is invite only and the source is private. You cannot audit the rules yourself; you can only observe their output.
- Backtests can flatter. The workflow of choosing an index or stock “once you like the backtesting results” carries a real risk: settings and instruments picked because they fit the past may not fit the future. Test across different periods and keep expectations modest.
- Choppy markets are hard for any signal tool. When price moves sideways, rule based entries and exits can trigger and reverse more often than in trending conditions. Watch how the strategy behaves in ranges on your instrument.
- Index signals are not option signals. If you trade options from index markers, premium behaviour, time decay and liquidity can differ sharply from what the index chart shows.
- Automation adds its own risks. Alerts can fail, connections can drop, and orders can fill at different prices than the chart suggests. Any automated setup needs monitoring.
- No published performance. There are no performance figures on the TradingView page and none on this site. You judge it for yourself.
Versions
Besides the published script, Arko’s private script list contains two earlier builds. They are not published.
| Version | Status |
|---|---|
| Arko’s Strategy 3 Strategy | An earlier build, not published. |
| Arko’s Strategy Redefined | An earlier build, not published. |
Release notes
All times in IST.
| Date | Note (from TradingView) |
|---|---|
| 13 Aug 2026, 08:49 | First published. |
| 6 Sep 2026, 14:43 | “More specific alerts” |
| 9 Sep 2026, 00:07 | “Minor changes.” |
| 12 Sep 2026, 05:22 | “More Alert system” |
Frequently asked questions
What is the difference between Arko’s Strategy and Arko’s Strategy Indicator? They give the same signals. Arko’s Strategy is the strategy version: use it to backtest in TradingView’s Strategy Tester. Arko’s Strategy Indicator is the indicator version: a clean chart with Buy, Sell, Close Long and Close Short signals, and alerts built for automation. Test with the strategy, trade and automate with the indicator.
Does Arko’s Strategy tell me what to trade? No. It draws markers based on its rules. We are not SEBI registered and do not give recommendations, tips or calls. Every decision is yours.
Which markets does it work on? The TradingView description says it works on any chart and mentions indices and stocks. We focus on Nifty, BankNifty, Sensex and MCX.
Which timeframe should I use? It works on any timeframe. Pick the one that held up best in backtests for your market, in the Strategy Tester or in the research reports.
Can I automate trades with it? The description says that once you like the backtesting results on an index or stock, you can automate your trades, and the recent updates added more alerts. Automation runs through TradingView alerts and your own broker setup, for example with Vyuh. You are responsible for every order, and should test with small quantities first.
Can I see or change the code? No. The script is invite only and the code stays private.
Do I need a paid TradingView plan? Only for some TradingView features. Alerts, webhook URLs and more chart layouts need a paid plan. For real time prices, connecting your broker account to TradingView may be enough: Dhan, for example, brings real time Indian market data into TradingView. Other brokers are on TradingView’s broker list. Sending alerts to automation software uses webhooks, so it needs a paid plan.
How do I get access? Choose a plan on the pricing page, then send us your TradingView username. We add you to the invite only script.