Overview
Running two indicators side by side means deciding, every time, what to make of it when they disagree. The Multi-Asset Scanner settles that with a fixed rule. It takes the bullish and bearish readings of SmartTrend Dynamic Stop Navigator and the reading of Cash Market Sentiment, and turns them into one overall sentiment: bullish, bearish or neutral.
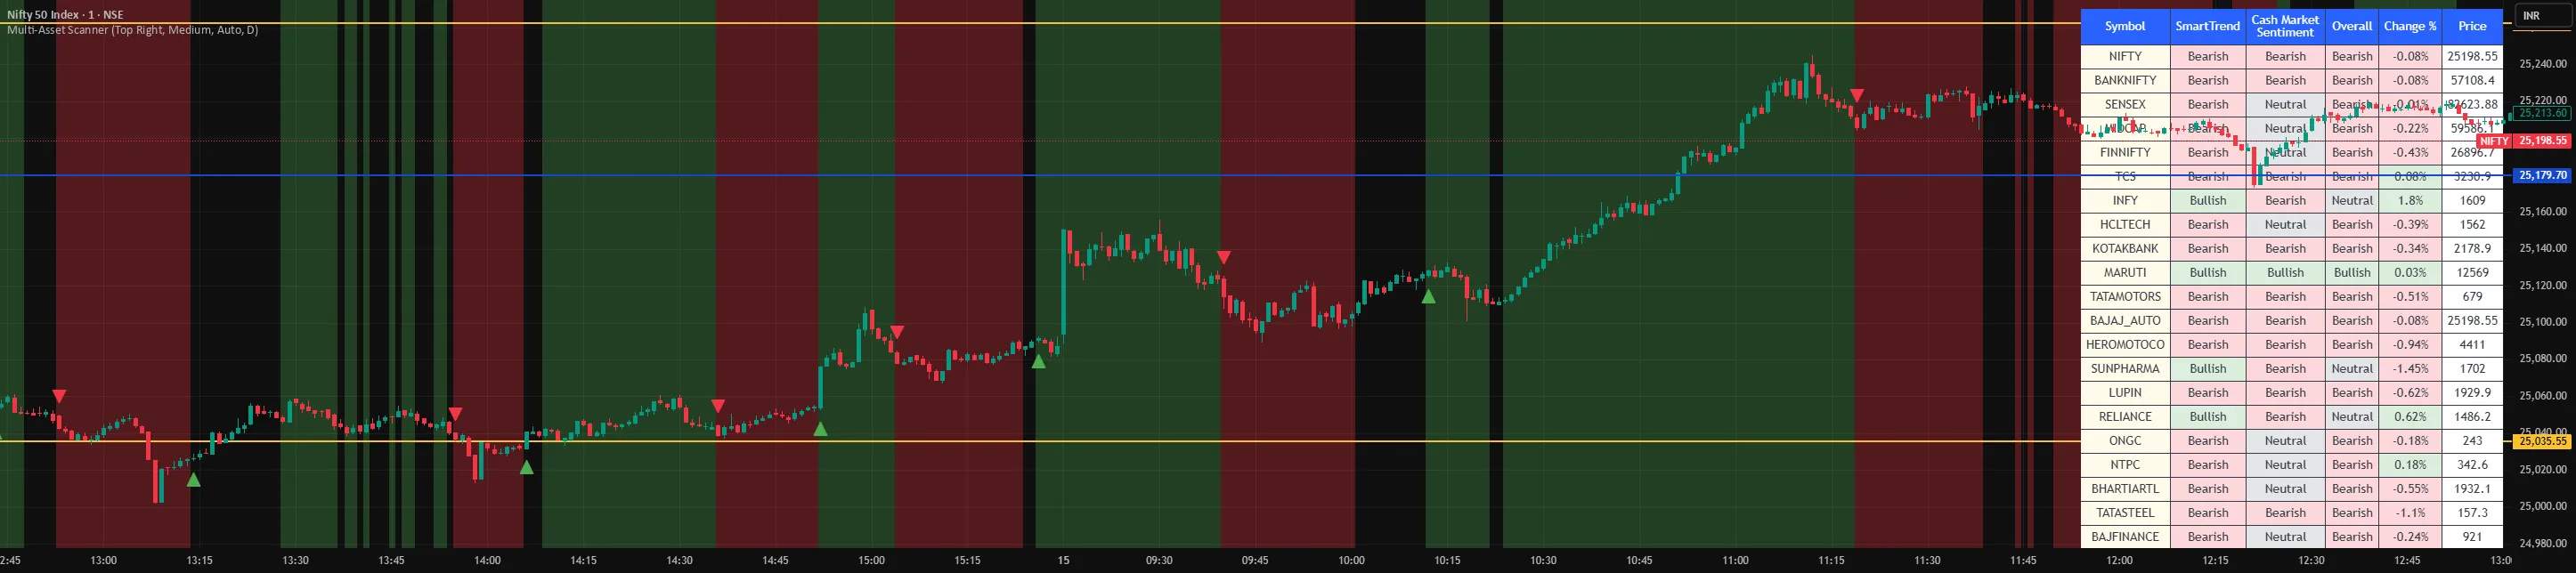
You see that overall sentiment in two places: as a background colour on the chart, and in a table. When the two readings disagree, the result is neutral and the background stays clear.
On the older Derivatives Indicators website it was listed as “Multi Asset Scanner on Trend & Cash Sentiment”, which describes what it combines: a trend reading and a cash market sentiment reading.
Who it suits
- Traders who already use both component indicators. It saves you reading two panels and combining them by eye.
- Traders who want a quick filter. A clear background marks stretches where the two readings disagree.
- Anyone who likes a single table view. The overall sentiment also appears in the table, which you can show or hide.
Who it does not suit
- Anyone looking for buy or sell calls. The overall sentiment is the output of a fixed rule, not advice.
- Anyone who needs to see or change the code. The script is invite only and the source stays private.
How it works
The published description sets out the rule in one paragraph. The scanner includes SmartTrend Dynamic Stop Navigator’s bullish and bearish signals and scans Cash Market Sentiment. Then:
| SmartTrend | Cash Market Sentiment | Overall sentiment |
|---|---|---|
| Bullish | Bullish | Bullish |
| Bearish | Bearish | Bearish |
| Bullish | Neutral | Bullish |
| Neutral | Bullish | Bullish |
| Bearish | Neutral | Bearish |
| Neutral | Bearish | Bearish |
| Bullish | Bearish | Neutral (no background colour) |
| Bearish | Bullish | Neutral (no background colour) |
| Neutral | Neutral | Neutral (no background colour) |
In short:
- Both agree: the overall sentiment is that reading.
- One is neutral: the overall sentiment follows the other one.
- They disagree, or both are neutral: the overall sentiment is neutral.
How the scanner reads the components internally is not published. The script is invite only and its logic is proprietary, so this page describes only what the public description and release notes say.
Why “multi asset”
The scanner shows the overall sentiment for more than one symbol at a time. It covers Indian indices and F&O stocks, and you choose which stocks appear on its list in the settings. MCX is coming soon.
How to read it on the chart
Background colour
| Overall sentiment | What you see |
|---|---|
| Bullish | A dark green background. |
| Bearish | A dark red background. |
| Neutral | No background colour. |
You can change both colours, or turn the background off, under Style → Background Color (Color 0 is the bullish green, Color 1 the bearish red).
SmartTrend markers
The scanner also marks SmartTrend’s signals on the price chart:
| Marker | What you see |
|---|---|
| ST Bull | A green triangle pointing up, below the bar. |
| ST Bear | A red triangle pointing down, above the bar. |
Both can be switched off or recoloured in the Style tab.
A stretch with no background means the two components disagreed, not that nothing happened. These colours are readings of a fixed rule, not recommendations.
The table
The description says you “will get to see the overall sentiment on the table as well” (quoted from TradingView). Since the 28 Jul 2025 update, you can show or hide the scanner table in the settings, which helps on a small screen or a crowded chart.
The table sits at the top right of the chart by default. You can move it with Table Position and change its text size with Label Font Size (medium by default).
Inputs and settings
Inputs tab
| Setting | Default | What it does |
|---|---|---|
| Show The Scanner Table | On | Shows or hides the table (added 28 Jul 2025). |
| Table Position | Top Right | Where the table sits on the chart. |
| Label Font Size | Medium | Text size in the table. |
| Timeframe Mode | Auto | Auto, or Manual to use the timeframe below. |
| Manual Timeframe | D (daily) | The timeframe used when Timeframe Mode is Manual. |
| Stocks on the list | Choose which F&O stocks the scanner shows. |
Style tab
| Setting | Default |
|---|---|
| ST Bull | Green triangle, below the bar |
| ST Bear | Red triangle, above the bar |
| Background Color | On: Color 0 dark green (bullish), Color 1 dark red (bearish) |
| Tables | On |
Timeframes and markets
Markets: Indian indices and F&O stocks. MCX is coming soon.
Timeframes: the scanner has a Timeframe Mode setting, Auto by default; set it to Manual to choose a timeframe yourself (daily by default). For context, SmartTrend’s own description suggests 1 minute to 3 minute charts for intraday and longer timeframes for swing trading.
Getting started
- Get access. Choose a plan on the pricing page and pay online. The order form asks for your TradingView username; we never ask for your TradingView password.
- Access arrives by itself. Once the payment goes through, the script is added to your TradingView username automatically, usually within a few minutes, and we email you when it’s done.
- Add it to a chart. In TradingView, click Indicators, open Invite-only scripts, and choose Multi-Asset Scanner.
- Learn the two components first. Read the SmartTrend Dynamic Stop Navigator and Cash Market Sentiment pages so you know what feeds the overall reading.
- Scroll back and study. Look at where the background was bullish, bearish or clear, and how price behaved in each.
- Hide the table if you need room. Use the show or hide option in the settings.
Strengths and limitations
Strengths
- One reading instead of two. The combining rule is simple and stated publicly, so you know what the colour means.
- Disagreement is visible. A clear background marks stretches where trend and cash sentiment disagree.
- Two views of the market. It brings together a trend reading and a volume participation reading.
- Flexible layout. The table can be shown or hidden.
Limitations
- Only as good as its inputs. It inherits the limits of both components: trailing trend readings lag, and volume based sentiment can diverge from price for a long time.
- Agreement is not confirmation of outcome. Two indicators agreeing says nothing about what price will do next.
- No MCX yet. It covers Indian indices and F&O stocks; MCX is coming soon.
- Closed code. It is invite only with private source, so you cannot audit the rule’s inputs, only observe the output.
- No published performance. No figures are given on TradingView or on this site.
Versions
There is one published version, covered on this page.
Release notes
All times in IST.
| Date | Note (from TradingView) |
|---|---|
| 16 Jul 2025, 19:56 | First published. |
| 21 Jul 2025, 05:45 | “Improved Version.” More stocks were added to the scanner. |
| 28 Jul 2025, 11:44 | “Option to show or hide the scanner table.” |
Frequently asked questions
What does the Multi-Asset Scanner combine? SmartTrend Dynamic Stop Navigator’s bullish and bearish readings and Cash Market Sentiment’s reading, into one overall sentiment.
When is the overall sentiment neutral? When one component is bullish and the other is bearish, or when both are neutral. In those regions there is no background colour.
What if only one of them has a reading? If one component is neutral, the overall sentiment follows the other: bullish if it is bullish, bearish if it is bearish.
Do I need the two component indicators as well? No. It works out both readings itself, so it runs on its own; you don’t need SmartTrend or Cash Market Sentiment on the chart.
Can I hide the table? Yes. An option to show or hide the scanner table was added on 28 Jul 2025.
Does it tell me what to trade? No. We are not SEBI registered and do not give recommendations, tips or calls. The overall sentiment is the output of a fixed rule, and every decision is yours.