12 Months Membership (Arko’s Strategy)
₹39,999.00
Smart Entries. Cleaner Exits. Better Clarity.
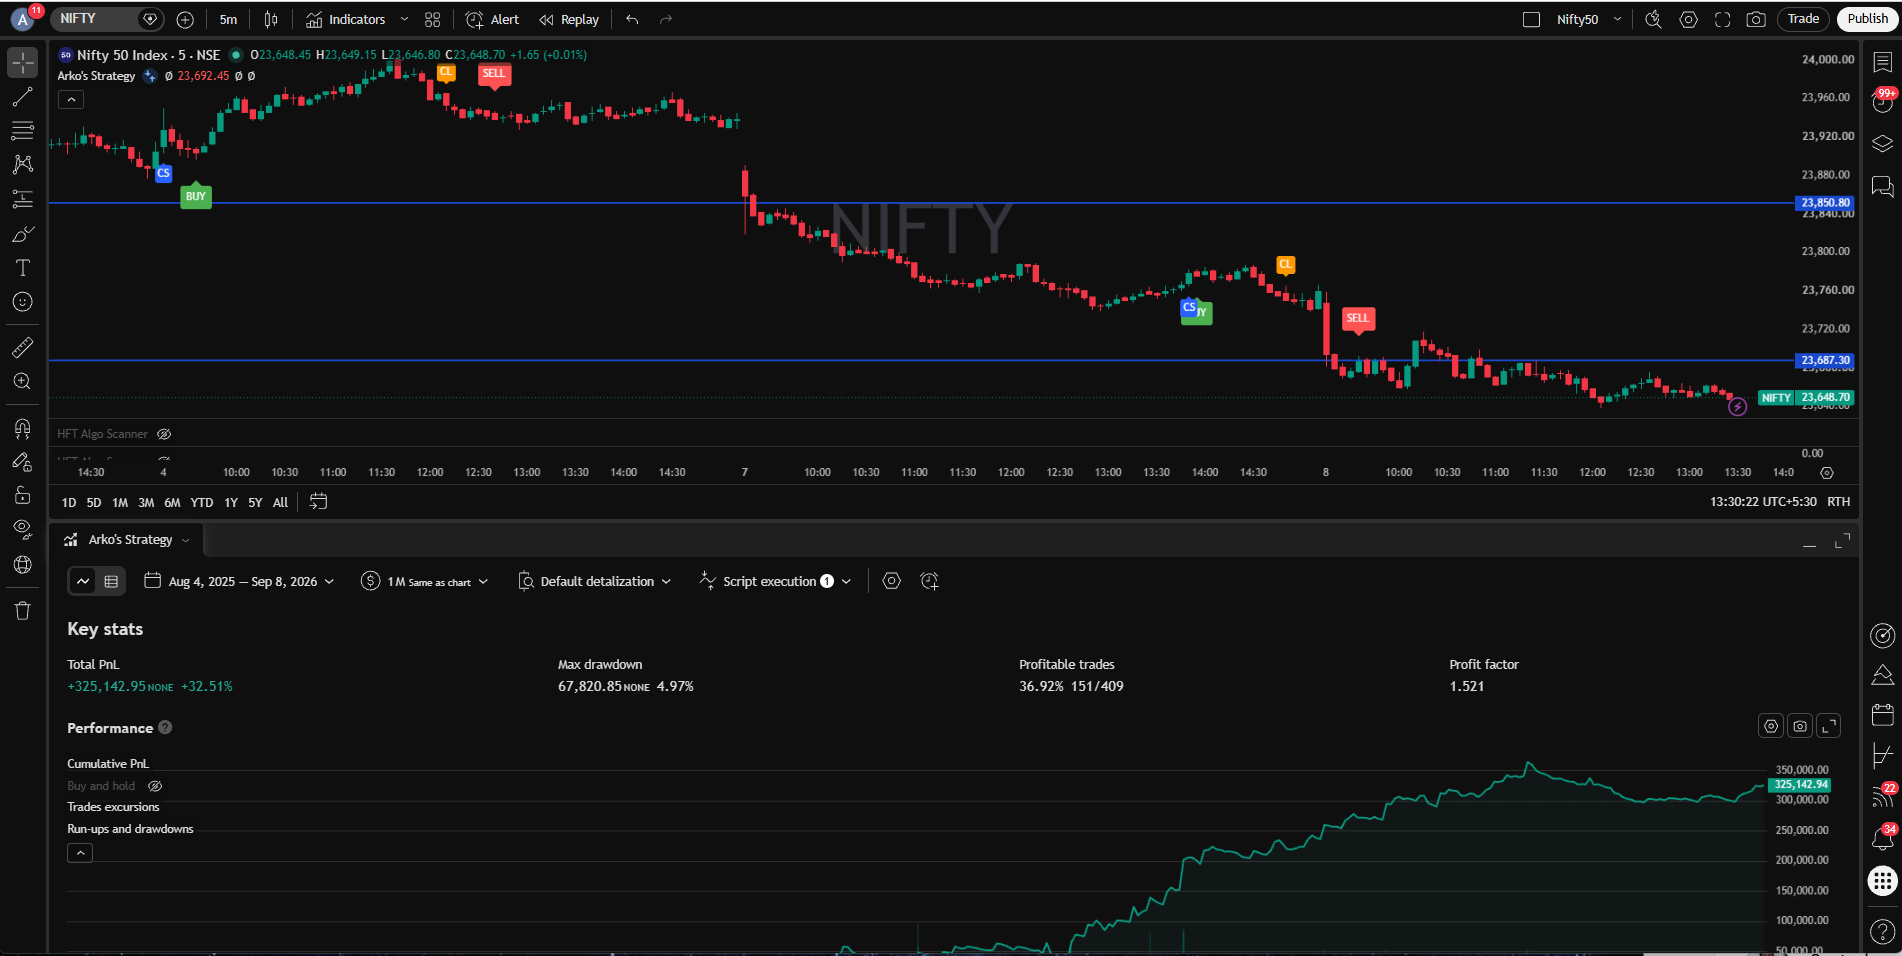
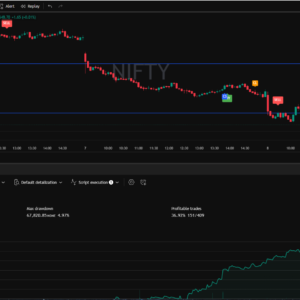
This strategy delivers precise Buy and Sell signals along with clear Close Long and Close Short markers — helping you stay focused on high-probability opportunities while cutting through market noise.
Designed for traders who value simplicity and discipline, it provides a structured approach to both entering and managing positions with visual clarity on the chart.
Whether you’re backtesting or trading live, this tool aims to bring greater consistency and confidence to your decision-making.
Works on any chart. You won’t have to change the settings over and over again, so once you like the backtesting results on any Index or stock, you can automate your trades with ease.
Description
Arko’s Strategy
Smart Entries. Cleaner Exits. Better Clarity.
This strategy delivers precise Buy and Sell signals along with clear Close Long and Close Short markers — helping you stay focused on high-probability opportunities while cutting through market noise.
Designed for traders who value simplicity and discipline, it provides a structured approach to both entering and managing positions with visual clarity on the chart.
Whether you’re backtesting or trading live, this tool aims to bring greater consistency and confidence to your decision-making.
Works on any chart. You won’t have to change the settings over and over again, so once you like the backtesting results on any Index or stock, you can automate your trades with ease.
Cash Market Sentiment Indicator
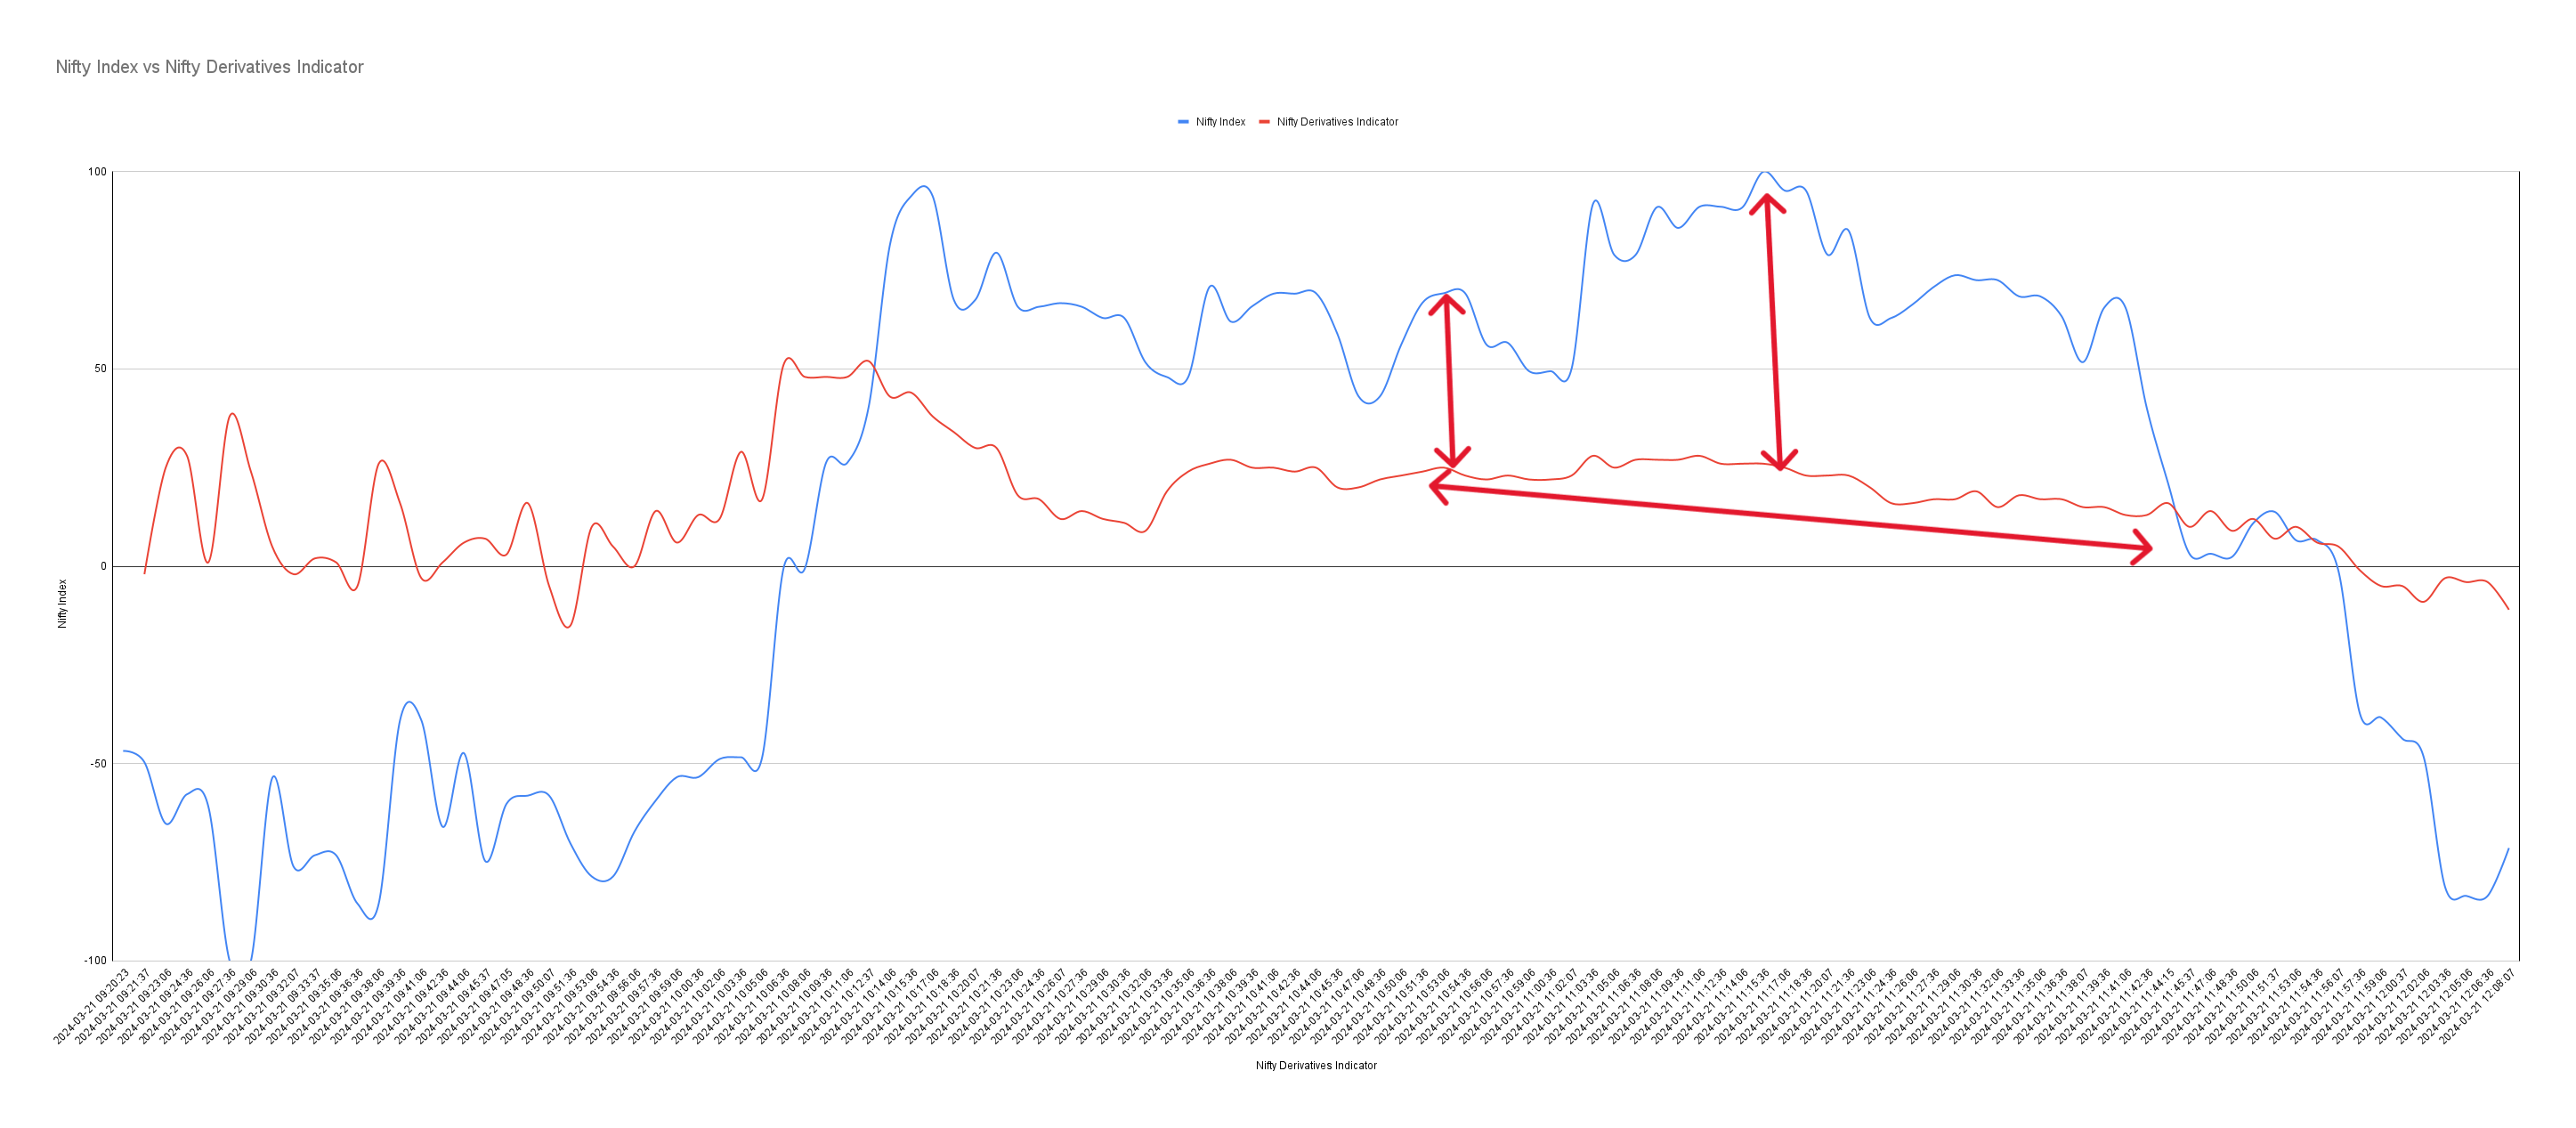
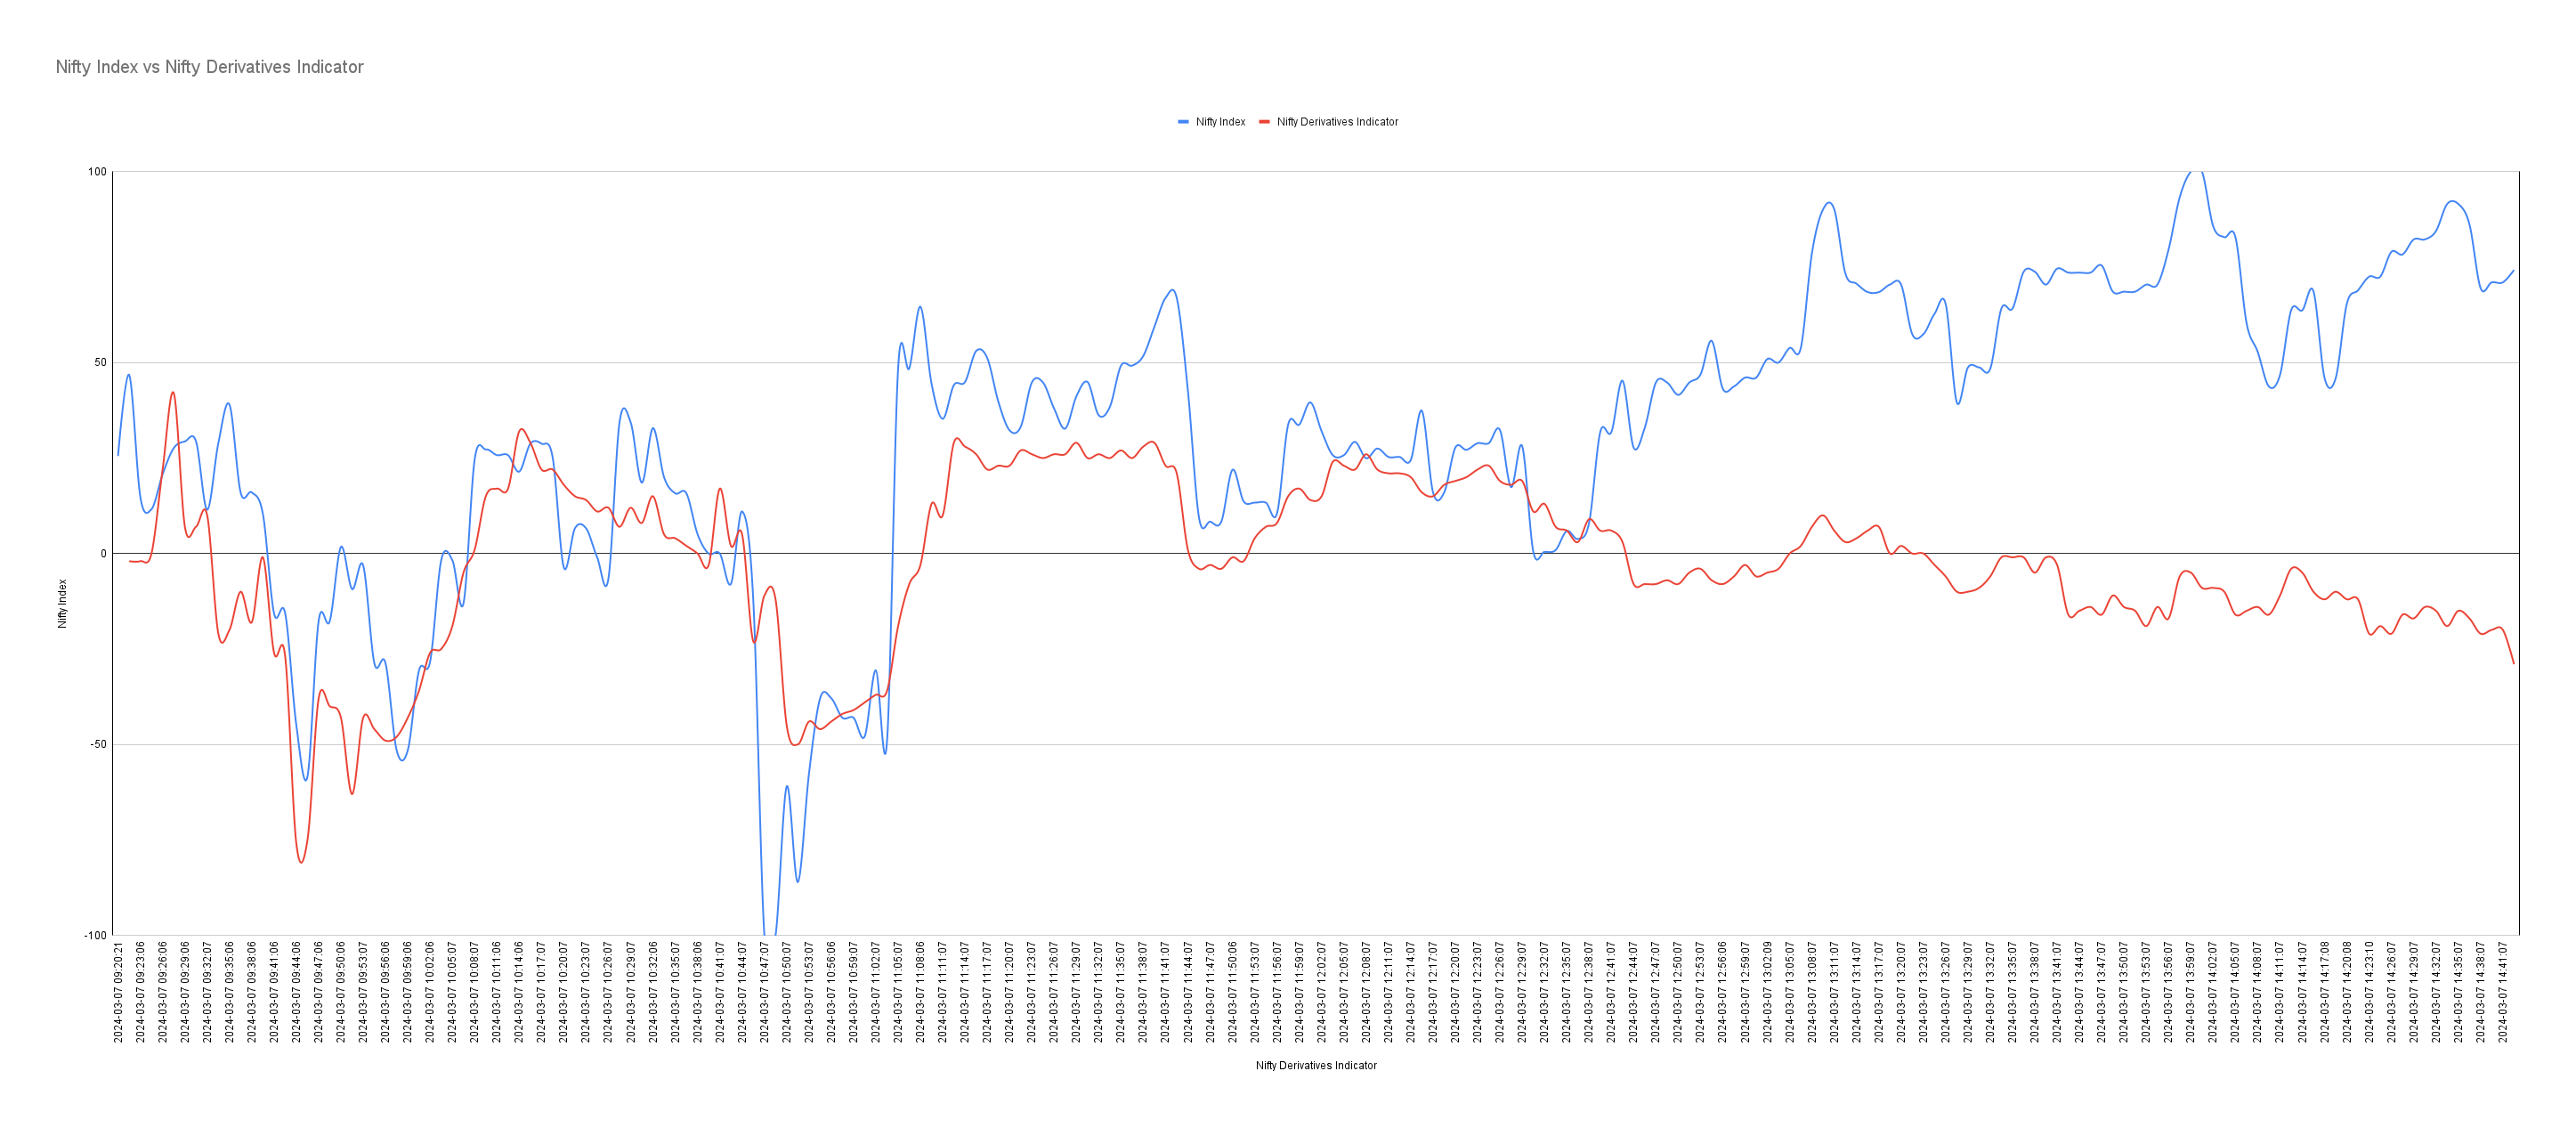
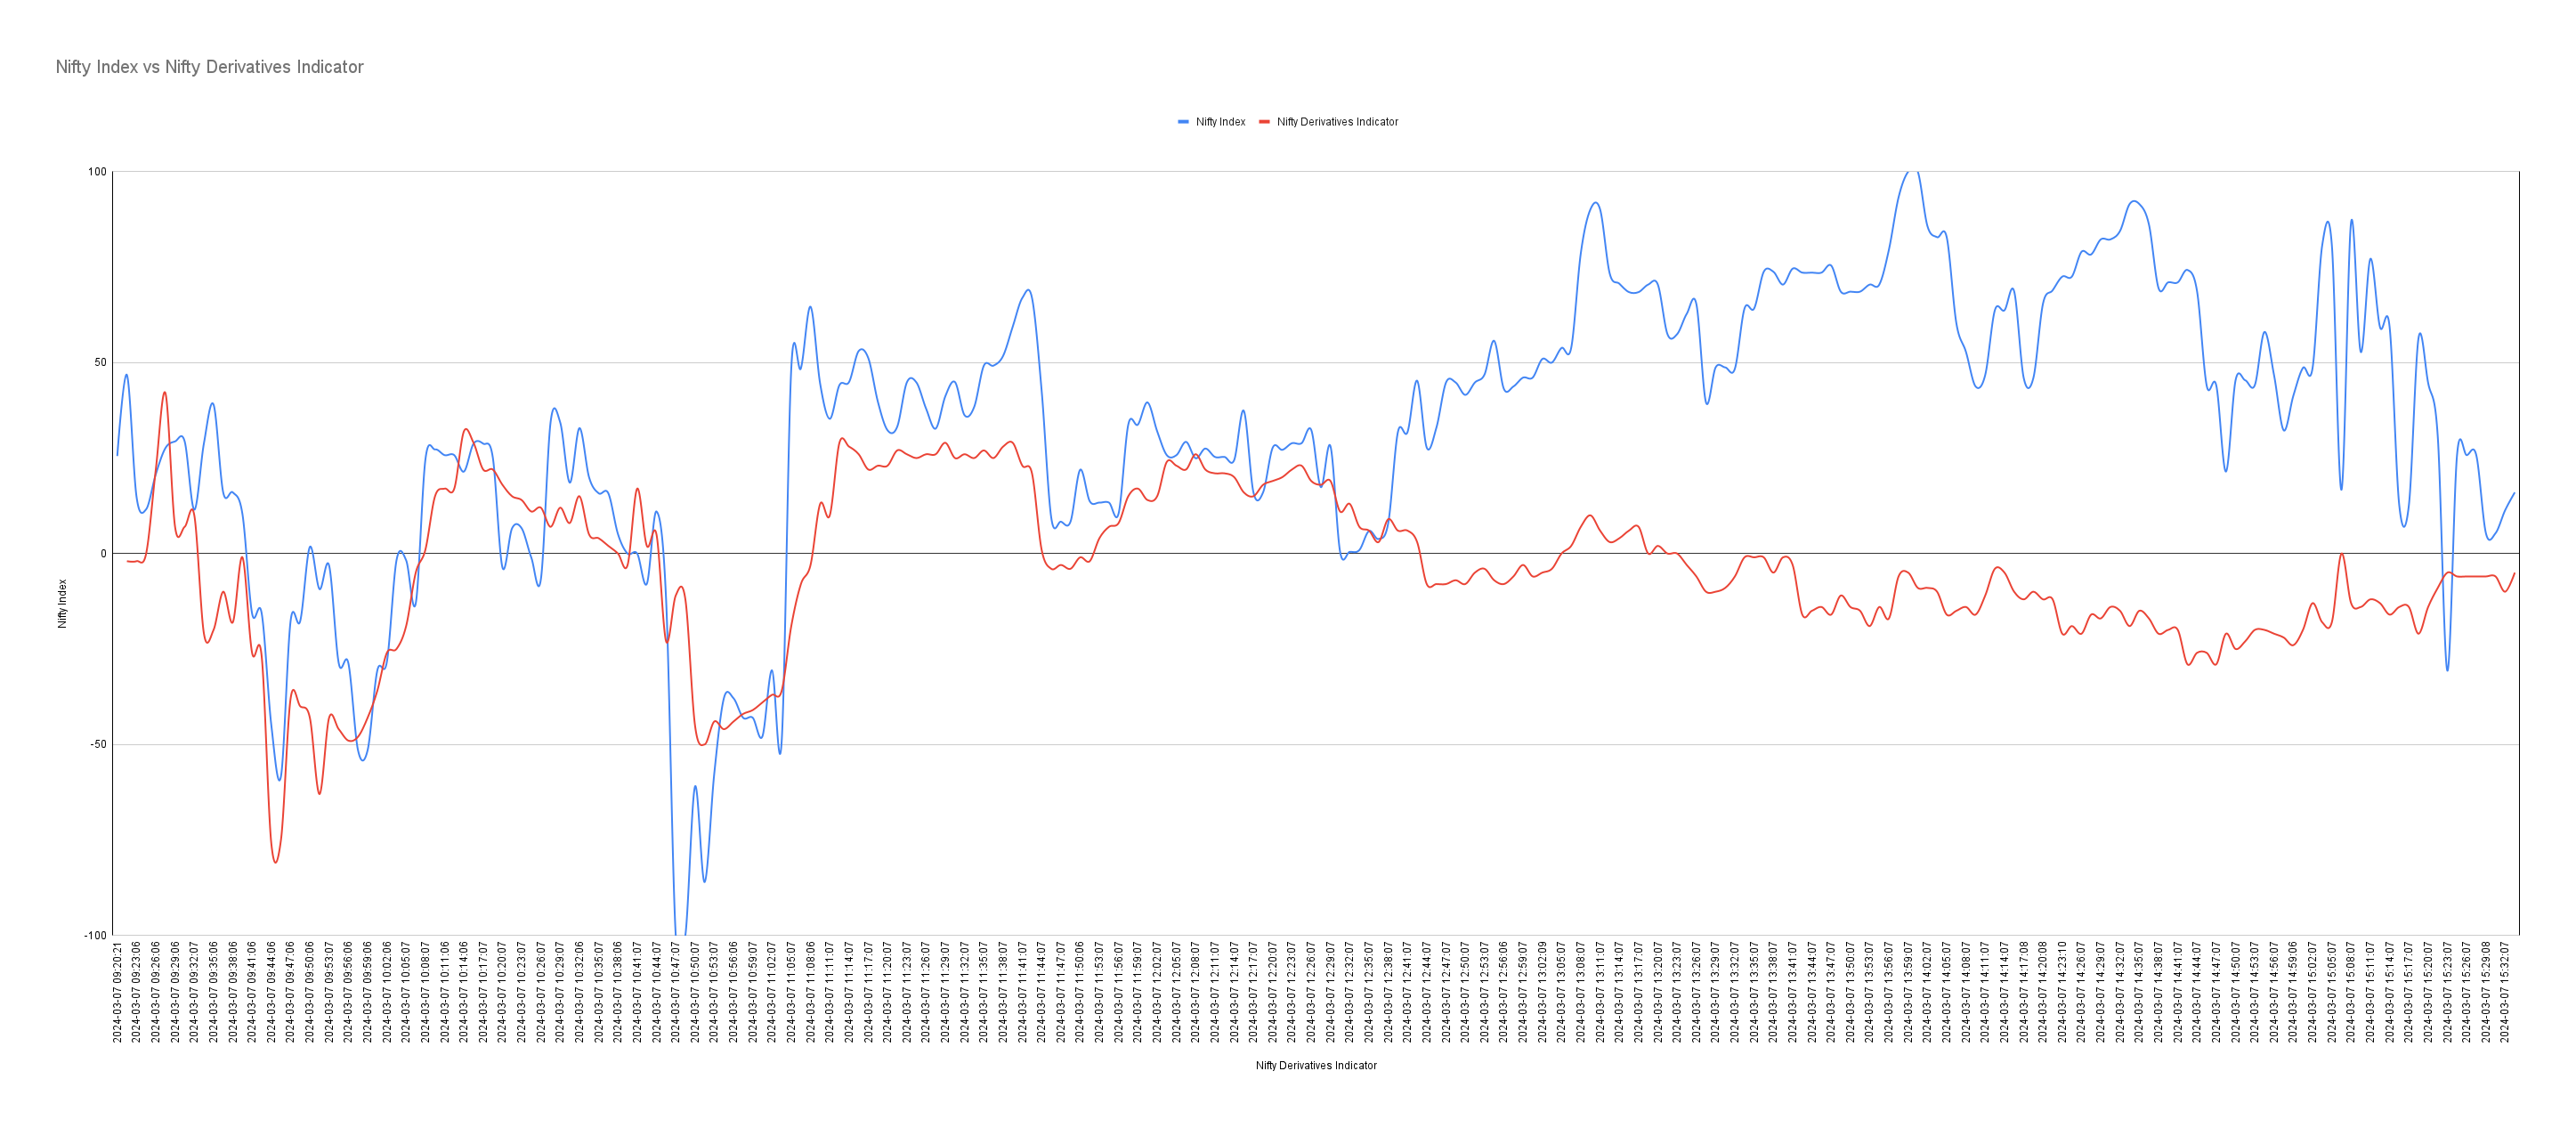
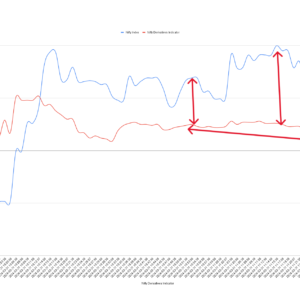
This is a powerful tool designed to gauge the underlying strength of market movements using real-time volume data. By analyzing trading volume patterns, it determines whether price shifts in indices or individual stocks are genuinely supported by robust participation—or if they’re potentially fragile and prone to reversal.
To maximize its effectiveness, monitor for divergences: When the indicator’s score trends upward while prices decline (bullish divergence), it may signal an impending rally. Conversely, a downward-trending score amid rising prices (bearish divergence) could indicate weakening momentum and a possible pullback. Integrate this with your chart analysis for more informed trading decisions, helping you spot opportunities where volume tells a different story than price alone.
Volume Cleaver
The Sharpest Realtime Buy/Sell Volume Splitter on TradingView See the real battle happening in every bar.
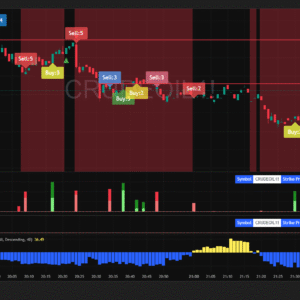
Volume Cleaver instantly cleaves each volume bar into two crystal-clear parts:
Bright Green ↑ = Pure Buy (Aggressive) Volume – above zero
Deep Red ↓ = Pure Sell (Aggressive) Volume – below zero
Live Realtime Accuracy
On the forming bar, it uses tick-by-tick logic to accumulate true buy and sell volume as the price moves — exactly like a professional tape reader. Clean On-Chart Summary Table
A sleek top-right panel shows the final numbers for the completed bar:
Buy Volume
Sell Volume
Total Volume
Perfect for:
Day traders & scalpers
Futures & stock traders
Anyone who wants to know who is really in control before the candle closes
Works on any timeframe, any chart that has volume data. Will also work on the basic free TradingView account.
Please note that the indicator only works in real-time, so if you reload the chart or the market is closed, you won’t be able to view its results.
No more guessing. No more flat volume bars hiding the truth.
Just pure, visual dominance — updated live.
SmartTrend Dynamic Stop Navigator
The “Momentum With Dynamic Stop” is a powerful trend-following indicator designed to assist traders in identifying potential entry points for long and short positions. It uses a dynamic stop mechanism that adjusts to market conditions, helping you stay in trends while providing clear exit levels. The indicator plots a trend-following stop level on the chart, along with a short-term trend line, to guide trading decisions. It generates labeled signals for entering trades, each accompanied by a stop level, making it easy to manage risk and follow market momentum.
Key Features
Dynamic Stop Level:
A volatility-adjusted stop that trails the Stop Loss, plotted on the chart.
Color-coded to reflect the current trend:
Green: Indicates an uptrend.
Red: Indicates a downtrend.
Blue: Indicates a neutral or undefined trend state.
Trend Line:
A short-term trend line plotted in blue to help visualize the market’s direction.
Entry Signals:
Long Signal: A “Buy” label appears with SL below the bar when conditions align for an upward move.
Short Signal: A “Sell” label appears with SL above the bar when conditions align for a downward move.
Each signal includes the current stop level for reference (e.g., “LongStop: 123.45”). But if the market moves in the direction of the signal then the stop loss dynamically changes and is shown by the Red or the Green line.
How to Use the Indicator:
Just check the signals that are being generated by the indicator, the smaller the timeframe better it will work for intraday traders try to keep it between 1 min to 3 mins timeframe chart but will also work on longer timeframes for swing traders as well.
Interpreting the Plots:
Stop Level: This line represents a dynamic stop that adjusts with market conditions. Its color indicates the trend:
Green: Uptrend.
Red: Downtrend.
Blue: Neutral trend.
Trend Line: A blue line that tracks the short-term market direction.
Identifying Entry Signals:
Long Entry:
A “Buy” label appears below the bar, indicating a potential buying opportunity.
The label includes the current stop level (e.g., “Buy, Stop: 123.45”).
Short Entry:
A “Sell” label appears above the bar, indicating a potential selling opportunity.
The label includes the current stop level (e.g., “Sell, Stop: 123.45”).
Trading Suggestions:
Use the stop level shown in the label to set a stop-loss for risk management.
Trend Confirmation:
Use the color of the stop level to confirm the overall trend direction. For example, a green stop level during a long signal supports an uptrend.
Setting Alerts:
To receive notifications for entry signals:
Set up an alert for “TrendMaster Long” to be notified of long signals.
Set up an alert for “TrendMaster Short” to be notified of short signals.
Configure your preferred notification method (e.g., email, SMS, or popup).
Additional Notes
Fixed Settings:
The indicator uses predefined settings to ensure consistent performance across all charts and timeframes.
No adjustments are needed, making it straightforward to use.
Signal Reliability:
The indicator combines multiple conditions to generate signals, aiming to filter out noise and improve reliability.
For best results, consider using it alongside your broader trading strategy or additional analysis.
Disclaimer:
Indicators are technical tool developed for educational and informational purposes only. It is not intended to provide any financial advice, investment recommendations, or signals to buy, sell, or hold any financial instruments. The indicator generates signals and displays stop levels based on predefined calculations and should not be construed as a suggestion or endorsement to execute any trades.
Trading and investment decisions involve significant risks, including the potential loss of capital. Users are solely responsible for conducting their own due diligence, assessing market conditions, and consulting with a qualified financial advisor or registered investment professional before making any investment decisions. The developer of this indicator does not accept liability for any losses or damages arising from the use of this tool.
This indicator is provided “as is” without any warranties, and its performance is not guaranteed. Past performance is not indicative of future results. Compliance with all applicable laws and regulations, including those of SEBI, is the user’s responsibility.
Reviews
There are no reviews yet.