HFT Algo Scanner on TradingView


HFT Algo Scanner for Indices & Stocks (F&O)
Introducing our flagship model, designed to track the real-time positions of major institutional players directly on TradingView. We’ve tailored it to cover key indices including Nifty, Banknifty, Sensex, Finnifty, and Midcpnifty, as well as all major stocks that are traded in F&O. Beyond that, we’ve expanded our coverage to include additional stocks based on popular demand from our followers. Looking for more? We’re ready to customize and add further stocks to meet our customers’ needs!
Our indicator is engineered to decode real-time moves by major institutions within the option chain. It reveals whether they’re writing calls (light red), buying calls (deep green), writing puts (light green), or buying puts (deep red). As Big Institutions mostly write options so we follow the significant put and call writing positions made by them and can trace reversals helping both buyers and sellers since as an option trader one needs direction. Beyond just their actions, it quantifies the capital behind these positions, empowering you to align with them only when they’re making significant bets. This tool sharpens your ability to spot reversals, identify support levels, or anticipate a flat market when institutions take balanced positions on both sides.
Check out our X profile and YouTube channel for a wealth of live, real-time posts showcasing the indicator’s analysis. These examples highlight its accuracy and give you a firsthand look at the strength of our algorithm in action.
Indices on HFT Algo Scanner: Nifty50, Banknifty, Sensex, Finnifty, Midcpnifty
Stocks on HFT Algo Scanner: All Nifty50 Stocks, #AARTIIND #ABB #ABBOTINDIA #ABCAPITAL #ABFRL #ACC #ADANIENSOL #ADANIGREEN #ADANIPOWER #ALKEM #AMBUJACEM #ANGELONE #APLAPOLLO #APLLTD #APOLLOTYRE #ARE&M #ASHOKLEY #ASTRAL #ATGL #ATUL #AUBANK #AUROPHARMA #BALKRISIND #BANDHANBNK #BANKBARODA #BANKINDIA #BATAINDIA #BERGEPAINT #BHARATFORG #BHARATRAS #BHEL #BIOCON #BOSCHLTD #BSE #BSOFT #CAMS #CANBK #CANFINHOME #CDSL #CESC #CGPOWER #CHAMBLFERT #CHOLAFIN #COFORGE #COLPAL #CONCOR #COROMANDEL #CROMPTON #CUB #CUMMINSIND #CYIENT #DABUR #DALBHARAT #DEEPAKNTR #DELHIVERY #DIVISLAB #DLF #DMART #ESCORTS #EXIDEIND #FEDERALBNK #GAIL #GLENMARK #GMRAIRPORT #GNFC #GODREJCP #GODREJPROP #GRANULES #GUJGASLTD #HAL #HAVELLS #HDFCAMC #HFCL #HINDCOPPER #HINDPETRO #HUDCO #ICICIGI #ICICIPRULI #IDEA #IDFCFIRSTB #IGL #INDHOTEL #INDIAMART #INDIANB #INDIGO #INDUSTOWER #IOC #IPCALAB #IRB #IRCTC #IRFC #JINDALSTEL #JKCEMENT #JSL #JSWENERGY #KALYANKJIL #KEI #KPITTECH #LALPATHLAB #LAURUSLABS #LICHSGFIN #LICI #LODHA #LTF #LTIM #LTTS #LUPIN #M&MFIN #MANAPPURAM #MARICO #MAXHEALTH #MCX #METROPOLIS #MFSL #MGL #MPHASIS #MRF #MUTHOOTFIN #NATIONALUM #NAUKRI #NAVINFLUOR #NBCC #NCC #NHPC #NMDC #NYKAA #OBEROIRLTY #OFSS #OIL #PAGEIND #PAYTM #PEL #PERSISTENT #PETRONET #PFC #PIDILITIND #PIIND #PNB #POLICYBZR #POONAWALLA #PRESTIGE #PVRINOX #RAMCOCEM #RBLBANK #SAIL #SBICARD #SHREECEM #SIEMENS #SJVN #SONACOMS #SRF #SUNTV #SUPREMEIND #SYNGENE #TATACHEM #TATACOMM #TATAELXSI #TATAPOWER #TIINDIA #TORNTPHARM #TORNTPOWER #TVSMOTOR #UNIONBANK #UNITDSPR #UPL #VBL #VEDL #VOLTAS #YESBANK #ZEEL #ZOMATO #ZYDUSLIFE
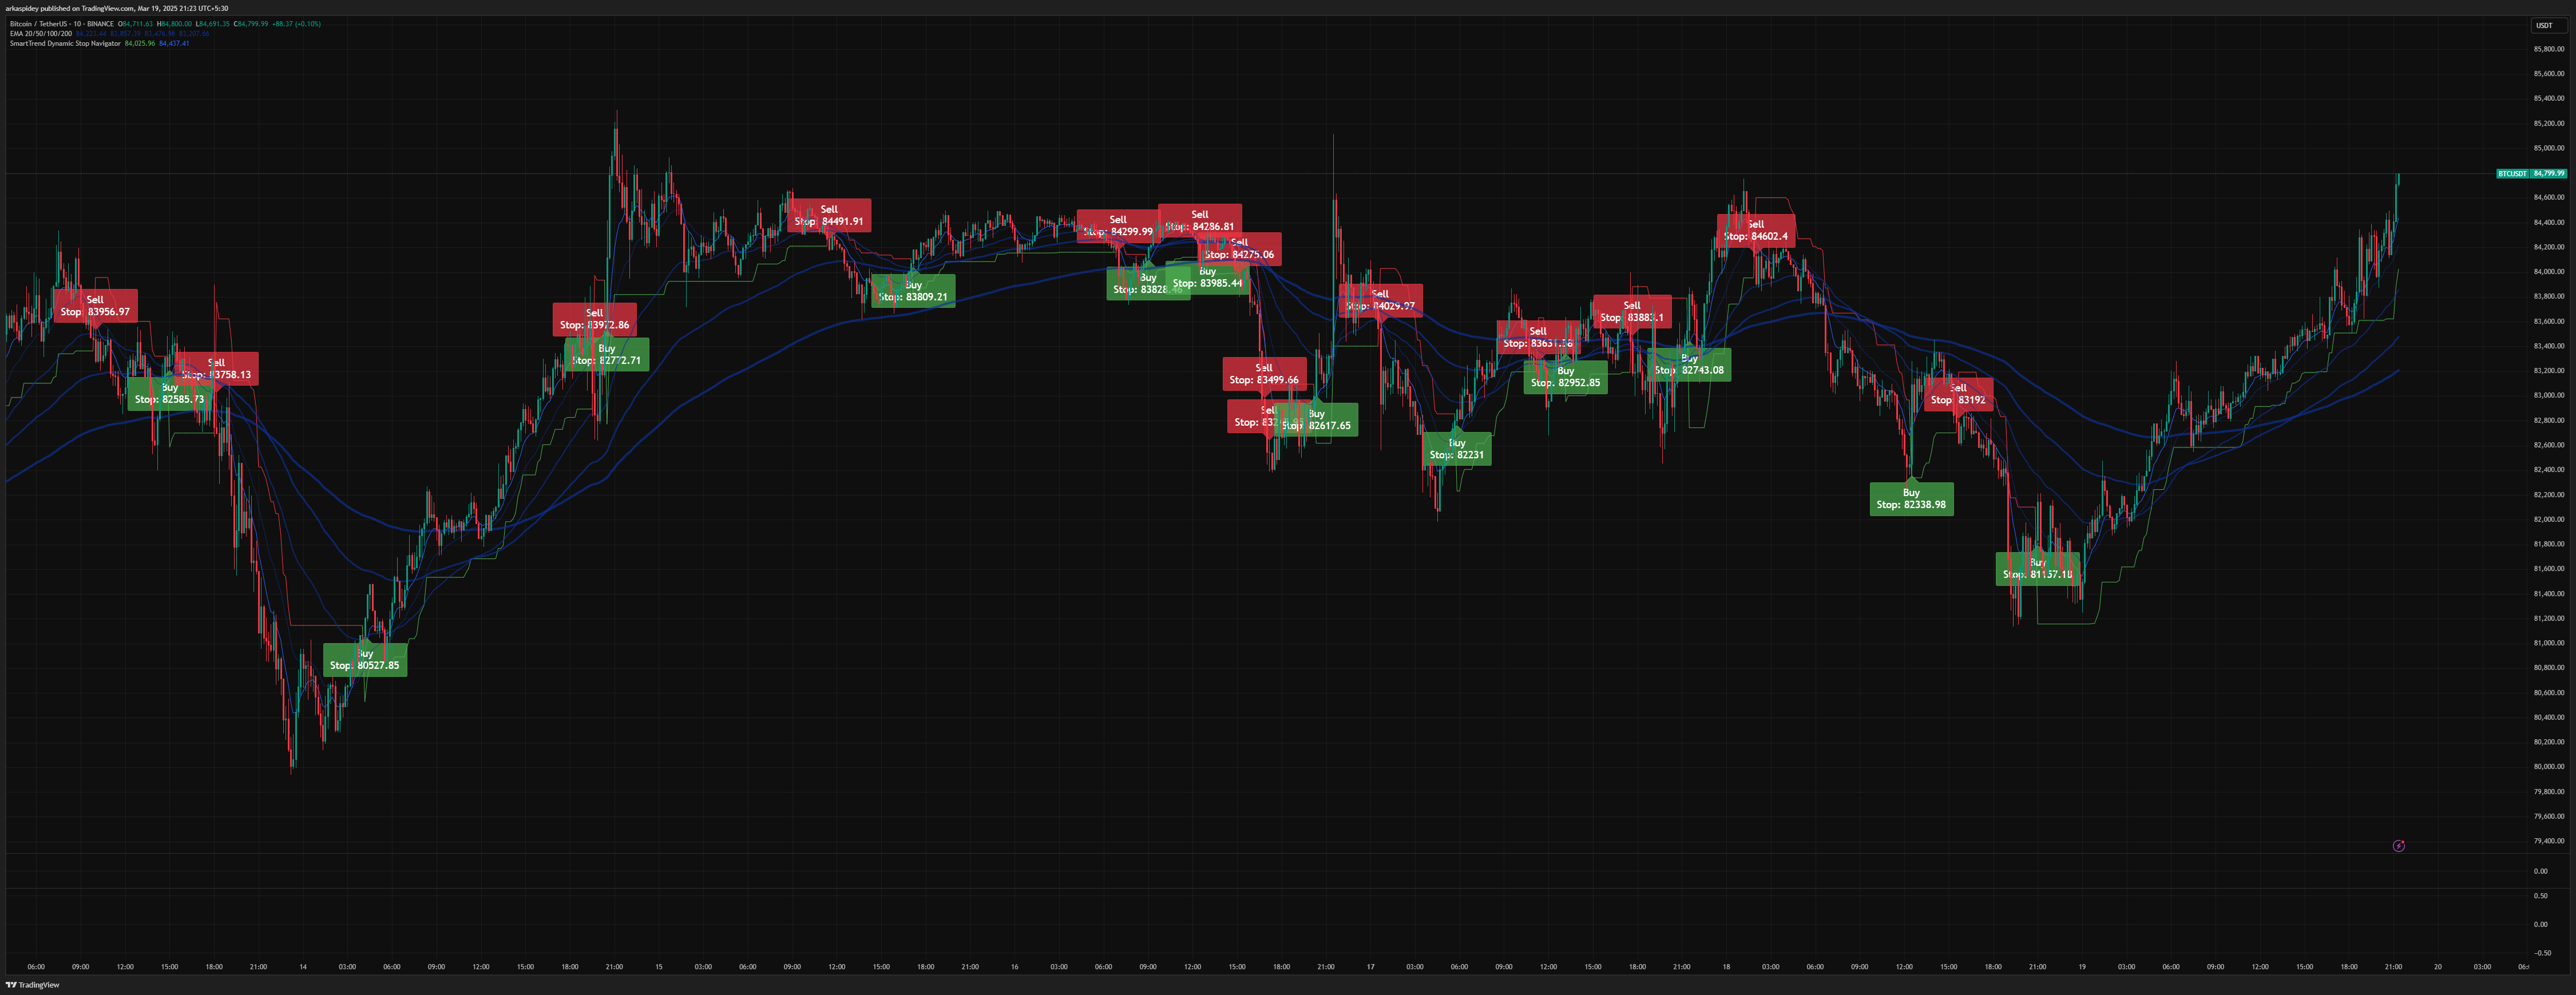
SmartTrend Dynamic Stop Navigator on Tradingview


This indicator can be used on any stock or Indices and even for crypto as well. Just open the chart and apply the indicator and it starts working.
Indicator Description
The SmartTrend Dynamic Stop Navigator is a powerful trend-following indicator designed to assist traders in identifying potential entry points for long and short positions. It uses a dynamic stop mechanism that adjusts to market conditions, helping you stay in trends while providing clear exit levels. The indicator plots a trend-following stop level on the chart, along with a short-term trend line, to guide trading decisions. It generates labeled signals for entering trades, each accompanied by a stop level, making it easy to manage risk and follow market momentum.
Key Features
Dynamic Stop Level:
A volatility-adjusted stop that trails the Stop Loss, plotted on the chart.
Color-coded to reflect the current trend:
Green: Indicates an uptrend.
Red: Indicates a downtrend.
Blue: Indicates a neutral or undefined trend state.
Trend Line:
A short-term trend line plotted in blue to help visualize the market’s direction.
Entry Signals:
Long Signal: A “Buy” label appears with SL below the bar when conditions align for an upward move.
Short Signal: A “Sell” label appears with SL above the bar when conditions align for a downward move.
Each signal includes the current stop level for reference (e.g., “Long\Stop: 123.45”). But if the market moves in the direction of the signal then the stop loss dynamically changes and is shown by the Red or the Green line.
How to Use the Indicator:
Just check the signals that are being generated by the indicator.
Interpreting the Plots:
Stop Level: This line represents a dynamic stop that adjusts with market conditions. Its color indicates the trend:
Green: Uptrend.
Red: Downtrend.
Blue: Neutral trend.
Trend Line: A blue line that tracks the short-term market direction.
Identifying Entry Signals:
Long Entry:
A “Buy” label appears below the bar, indicating a potential buying opportunity.
The label includes the current stop level (e.g., “Buy, Stop: 123.45”).
Short Entry:
A “Sell” label appears above the bar, indicating a potential selling opportunity.
The label includes the current stop level (e.g., “Sell, Stop: 123.45”).
Trading Suggestions:
Use the stop level shown in the label to set a stop-loss for risk management.
Trend Confirmation:
Use the color of the stop level to confirm the overall trend direction. For example, a green stop level during a long signal supports an uptrend.
Setting Alerts:
To receive notifications for entry signals:
Set up an alert for “TrendMaster Long” to be notified of long signals.
Set up an alert for “TrendMaster Short” to be notified of short signals.
Configure your preferred notification method (e.g., email, SMS, or popup).
Additional Notes
Fixed Settings:
The indicator uses predefined settings to ensure consistent performance across all charts and timeframes.
No adjustments are needed, making it straightforward to use.
Signal Reliability:
The indicator combines multiple conditions to generate signals, aiming to filter out noise and improve reliability.
For best results, consider using it alongside your broader trading strategy or additional analysis.
Disclaimer:
This “SmartTrend Dynamic Stop Navigator” indicator is a technical tool developed for educational and informational purposes only. It is not intended to provide any financial advice, investment recommendations, or signals to buy, sell, or hold any financial instruments. The indicator generates signals and displays stop levels based on predefined calculations and should not be construed as a suggestion or endorsement to execute any trades.
Trading and investment decisions involve significant risks, including the potential loss of capital. Users are solely responsible for conducting their own due diligence, assessing market conditions, and consulting with a qualified financial advisor or registered investment professional before making any investment decisions. The developer of this indicator does not accept liability for any losses or damages arising from the use of this tool.
This indicator is provided “as is” without any warranties, and its performance is not guaranteed. Past performance is not indicative of future results. Compliance with all applicable laws and regulations, including those of SEBI, is the user’s responsibility.
AI Money Flow Indicators on Google Sheets


This is indicator is available for Nifty and Banknifty and the scores are displayed on a G-Sheet Live during the trading hours.
Python was used to write the codes. It has over 10,000 lines of code, is quite sophisticated, and requires a powerful system to run. Because it is not possible for everyone to execute this application on their PC, we will share the google sheet where you can obtain live updates during market hours.